
Figures & data
Table 1 Comparison of mean PI and MMI scores with 95% confidence intervals by sex, age, race, and pre-university academic ability (n=131)
Fig. 1. Correlation between PI and MMI scores: Pearson's correlation coefficient = 0.438 (p=0.001).
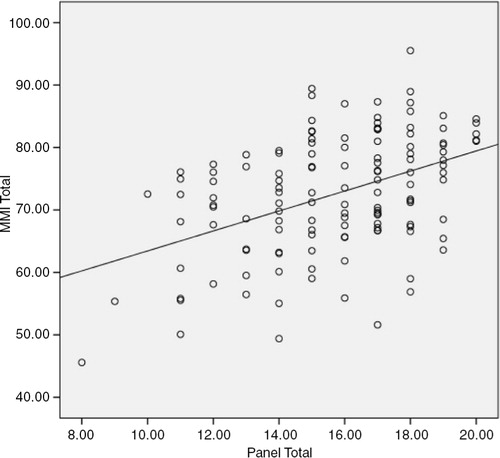
Table 2 Comparison of mean PI and MMI scores (95% CI) by assessment of concern (n=131)
Table 3 Number of subjects (%) responding to the acceptability questions on the MMI (n=173)
Table 4 Comparison of mean scores (95% CI) for questions on acceptability of the MMI by sex and race