Figures & data
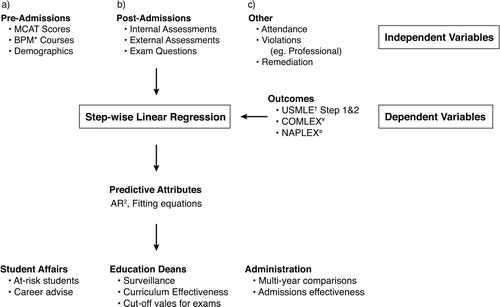
Fig. 1. Schema of biomedical student prediction analysis. This figure represents the steps that were used at the JCESOM to predict students who would most likely struggle on the USMLE standardized exams. This includes the identification of dependent and independent variables, the linear regression data generated, and the end users of these data in a medical school environment. *Represents undergraduate Biology, Physics, and Math scores; †represents United States Medical Licensure Exams; ¥represents the Comprehensive Osteopathic Medical Licensing Examination; and ørepresents the North American Pharmacist Licensure Examination.