Figures & data
Table 1 Overview of the six data sets compared in this study: the second version of the Goddard Satellite-Based Surface Turbulent Fluxes (GSSTF-2), the third version of the Hamburg Ocean Atmosphere Parameters and Fluxes from Satellite Data (HOAPS-3), Japanese Ocean Fluxes Data Sets with Use of Remote Sensing Observations (J-OFURO), Objectively Analyzed Air–Sea Fluxes for the Global Oceans (OAFlux), National Centers for Environmental Prediction Reanalysis 2 (NCEP-2) and the European Centre for Medium-Range Weather Forecasts 40 Year Re-analysis (ERA-40).
Fig. 1 Annual mean latent heat flux over the Southern Ocean for the second version of the Goddard Satellite-Based Surface Turbulent Fluxes (GSSTF-2), the third version of the Hamburg Ocean Atmosphere Parameters and Fluxes from Satellite Data (HOAPS-3), Japanese Ocean Fluxes Data Sets with Use of Remote Sensing Observations (J-OFURO), Objectively Analyzed Air–Sea Fluxes for the Global Oceans (OAFlux), National Centers for Environmental Prediction Reanalysis 2 (NCEP-2) and the European Centre for Medium-Range Weather Forecasts 40 Year Re-analysis (ERA-40).
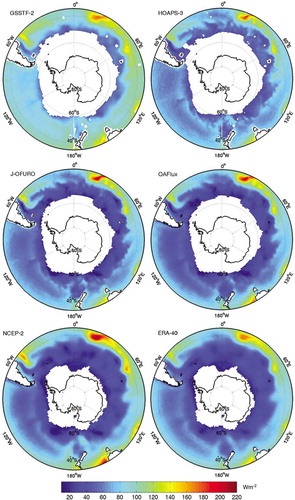
Fig. 2 Annual mean sensible heat flux over the Southern Ocean for the second version of the Goddard Satellite-Based Surface Turbulent Fluxes (GSSTF-2), the third version of the Hamburg Ocean Atmosphere Parameters and Fluxes from Satellite Data (HOAPS-3), Japanese Ocean Fluxes Data Sets with Use of Remote Sensing Observations (J-OFURO), Objectively Analyzed Air–Sea Fluxes for the Global Oceans (OAFlux), National Centers for Environmental Prediction Reanalysis 2 (NCEP-2) and the European Centre for Medium-Range Weather Forecasts 40 Year Re-analysis (ERA-40).
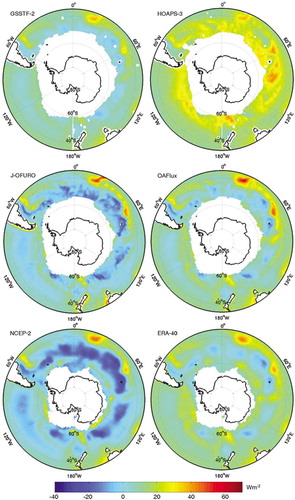
Fig. 3 The meridional distribution of the zonal mean (a) latent heat flux and (b) sensible heat flux from the second version of the Goddard Satellite-Based Surface Turbulent Fluxes (GSSTF-2), the third version of the Hamburg Ocean Atmosphere Parameters and Fluxes from Satellite Data (HOAPS-3), Japanese Ocean Fluxes Data Sets with Use of Remote Sensing Observations (J-OFURO), Objectively Analyzed Air–Sea Fluxes for the Global Oceans (OAFlux), National Centers for Environmental Prediction Reanalysis 2 (NCEP-2) and the European Centre for Medium-Range Weather Forecasts 40 Year Re-analysis (ERA-40). Also shown in (b) is the meridional distribution of the sea surface temperature (SST) and 2-m air temperature difference from OAFlux.
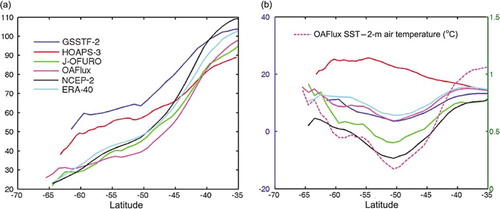
Fig. 4 Seasonal cycle of values averaged over regions south of 35°S for (a) latent heat flux and (b) sensible heat flux from the second version of the Goddard Satellite-Based Surface Turbulent Fluxes (GSSTF-2), the third version of the Hamburg Ocean Atmosphere Parameters and Fluxes from SatelliteData (HOAPS-3), Japanese Ocean Fluxes Data Sets with Use of Remote Sensing Observations (J-OFURO), Objectively Analyzed Air–Sea Fluxes for the Global Oceans (OAFlux), National Centers for Environmental Prediction Reanalysis 2 (NCEP-2) and the European Centre for Medium-Range Weather Forecasts 40 Year Re-analysis (ERA-40).
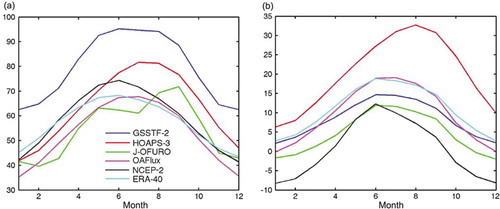
Fig. 5 Standard deviation of annual mean latent heat flux over the Southern Ocean for the second version of the Goddard Satellite-Based Surface Turbulent Fluxes (GSSTF-2), the third version of the Hamburg Ocean Atmosphere Parameters and Fluxes from Satellite Data (HOAPS-3), Japanese Ocean Fluxes Data Sets with Use of Remote Sensing Observations (J-OFURO), Objectively Analyzed Air–Sea Fluxes for the Global Oceans (OAFlux), National Centers for Environmental Prediction Reanalysis 2 (NCEP-2) and the European Centre for Medium-Range Weather Forecasts 40 Year Re-analysis (ERA-40).
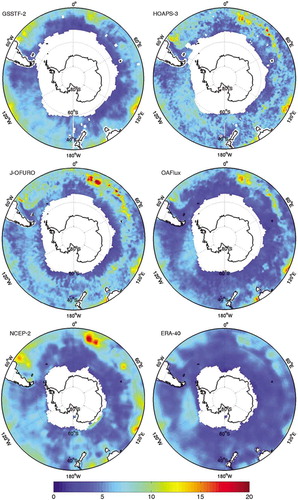
Fig. 6 Standard deviation of annual mean sensible heat flux over the Southern Ocean for the second version of the Goddard Satellite-Based Surface Turbulent Fluxes (GSSTF-2), the third version of the Hamburg Ocean Atmosphere Parameters and Fluxes from Satellite Data (HOAPS-3), Japanese Ocean Fluxes Data Sets with Use of Remote Sensing Observations (J-OFURO), Objectively Analyzed Air–Sea Fluxes for the Global Oceans (OAFlux), National Centers for Environmental Prediction Reanalysis 2 (NCEP-2) and the European Centre for Medium-Range Weather Forecasts 40 Year Re-analysis (ERA-40).
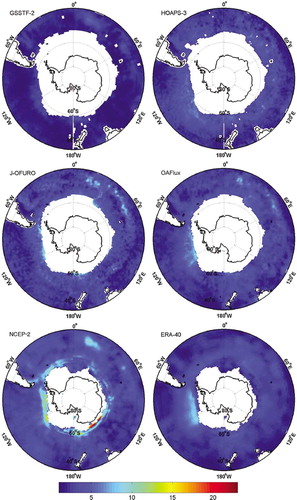
Fig. 7 Winter season correlation coefficients between the Antarctic Oscillation index and latent heat flux for the second version of the Goddard Satellite-Based Surface Turbulent Fluxes (GSSTF-2), the third version of the Hamburg Ocean Atmosphere Parameters and Fluxes from Satellite Data (HOAPS-3), Japanese Ocean Fluxes Data Sets with Use of Remote Sensing Observations (J-OFURO), Objectively Analyzed Air–Sea Fluxes for the Global Oceans (OAFlux), National Centers for Environmental Prediction Reanalysis 2 (NCEP-2) and the European Centre for Medium-Range Weather Forecasts 40 Year Reanalysis (ERA-40). Thin black lines indicate regions with correlation coefficients above the 95% confidence level.
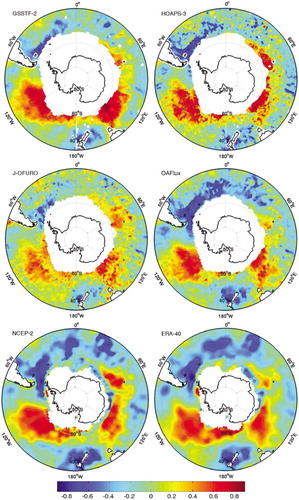
Fig. 8 Winter season correlation coefficients between the Antarctic Oscillation index and sensible heat flux for the second version of the Goddard Satellite-Based Surface Turbulent Fluxes (GSSTF-2), the third version of the Hamburg Ocean Atmosphere Parameters and Fluxes from Satellite Data (HOAPS-3), Japanese Ocean Fluxes Data Sets with Use of Remote Sensing Observations (J-OFURO), Objectively Analyzed Air–Sea Fluxes for the Global Oceans (OAFlux), National Centers for Environmental Prediction Reanalysis 2 (NCEP-2) and the European Centre for Medium-Range Weather Forecasts 40 Year Re-analysis (ERA-40). Thin black lines indicate regions with correlation coefficients above the 95% confidence level.
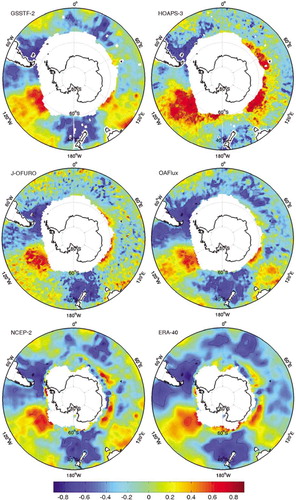
Fig. 9 Winter season correlations of Pacific-South American index and latent heat flux for the second version of the Goddard Satellite-Based Surface Turbulent Fluxes (GSSTF-2), the third version of the Hamburg Ocean Atmosphere Parameters and Fluxes from Satellite Data (HOAPS-3), Japanese Ocean Fluxes Data Sets with Use of Remote Sensing Observations (J-OFURO), Objectively Analyzed Air–Sea Fluxes for the Global Oceans (OAFlux), National Centers for Environmental Prediction Reanalysis 2 (NCEP-2) and the European Centre for Medium-Range Weather Forecasts 40 Year Re-analysis (ERA-40). Thin black lines indicate regions with correlation coefficients above the 95% confidence level.
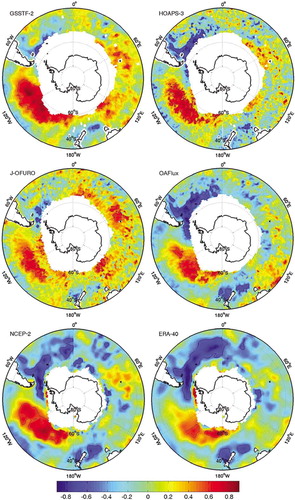
Fig. 10 Winter season correlations of Pacific-South American index and sensible heat flux for the second version of the Goddard Satellite-Based Surface Turbulent Fluxes (GSSTF-2), the third version of the Hamburg Ocean Atmosphere Parameters and Fluxes from Satellite Data (HOAPS-3), Japanese Ocean Fluxes Data Sets with Use of Remote Sensing Observations (J-OFURO), Objectively Analyzed Air–Sea Fluxes for the Global Oceans (OAFlux), National Centers for Environmental Prediction Reanalysis 2 (NCEP-2) and the European Centre for Medium-Range Weather Forecasts 40 Year Re-analysis (ERA-40). Thin black lines indicate regions with correlation coefficients above the 95% confidence level.
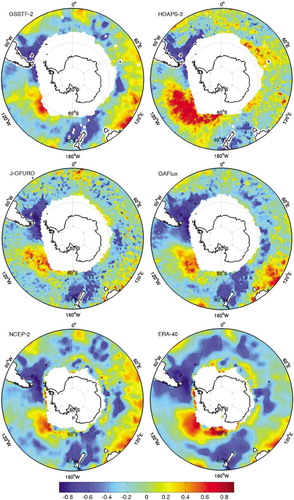
Fig. 11 The linear trends of annual mean latent heat flux over the Southern Ocean for the second version of the Goddard Satellite-Based Surface Turbulent Fluxes (GSSTF-2), the third version of the Hamburg Ocean Atmosphere Parameters and Fluxes from Satellite Data (HOAPS-3), Japanese Ocean Fluxes Data Sets with Use of Remote Sensing Observations (J-OFURO), Objectively Analyzed Air–Sea Fluxes for the Global Oceans (OAFlux), National Centers for Environmental Prediction Reanalysis 2 (NCEP-2) and the European Centre for Medium-Range Weather Forecasts 40 Year Re-analysis (ERA-40). Thin black lines indicate regions with correlation coefficients above the 90% confidence level.
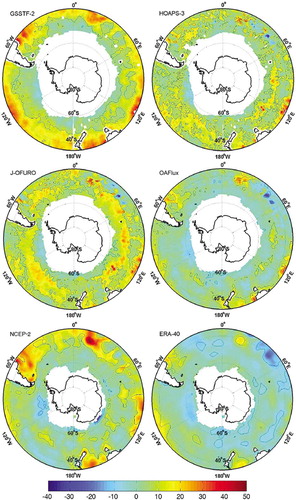
Fig. 12 The linear trends of annual mean sensible heat flux over the Southern Ocean for the second version of the Goddard Satellite-Based Surface Turbulent Fluxes (GSSTF-2), the third version of the Hamburg Ocean Atmosphere Parameters and Fluxes from Satellite Data (HOAPS-3), Japanese Ocean Fluxes Data Sets with Use of Remote Sensing Observations (J-OFURO), Objectively Analyzed Air–Sea Fluxes for the Global Oceans (OAFlux), National Centers for Environmental Prediction Reanalysis 2 (NCEP-2) and the European Centre for Medium-Range Weather Forecasts 40 Year Re-analysis (ERA-40). Thin black lines indicate regions with correlation coefficients above the 90% confidence level.
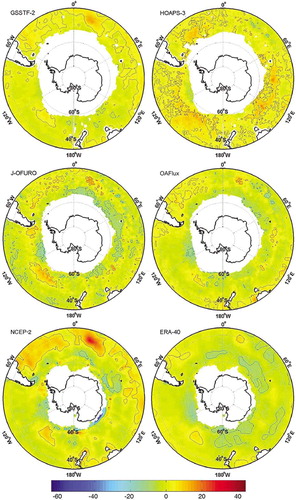
Fig. 13 Standard deviation of annual mean wind speed over the Southern Ocean for the second version of the Goddard Satellite-Based Surface Turbulent Fluxes (GSSTF-2), the third version of the Hamburg Ocean Atmosphere Parameters and Fluxes from Satellite Data (HOAPS-3), Japanese Ocean Fluxes Data Sets with Use of Remote Sensing Observations (J-OFURO), Objectively Analyzed Air–Sea Fluxes for the Global Oceans (OAFlux), National Centers for Environmental Prediction Reanalysis 2 (NCEP-2) and the European Centre for Medium-Range Weather Forecasts 40 Year Re-analysis (ERA-40).
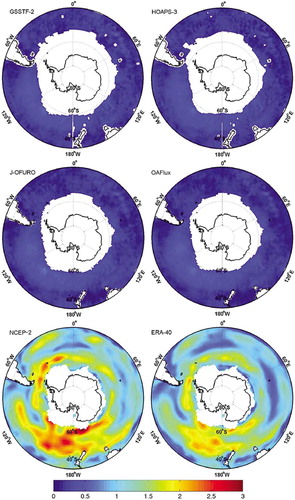
Fig. 14 The standard deviations of the annual mean sea-air specific humidity difference over the Southern Ocean for the second version of the Goddard Satellite-Based Surface Turbulent Fluxes (GSSTF-2), the third version of the Hamburg Ocean Atmosphere Parameters and Fluxes from Satellite Data (HOAPS-3), Japanese Ocean Fluxes Data Sets with Use of Remote Sensing Observations (J-OFURO), Objectively Analyzed Air–Sea Fluxes for the Global Oceans (OAFlux), National Centers for Environmental Prediction Reanalysis 2 (NCEP-2) and the European Centre for Medium-Range Weather Forecasts 40 Year Re-analysis (ERA-40).
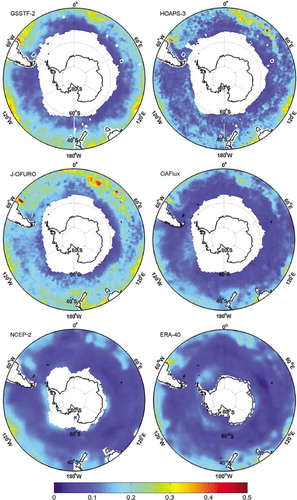
Fig. 15 The linear trends of the annual mean wind speed over the Southern Ocean for the second version of the Goddard Satellite-Based Surface Turbulent Fluxes (GSSTF-2), the third version of the Hamburg Ocean Atmosphere Parameters and Fluxes from Satellite Data (HOAPS-3), Japanese Ocean Fluxes Data Sets with Use of Remote Sensing Observations (J-OFURO), Objectively Analyzed Air–Sea Fluxes for the Global Oceans (OAFlux), National Centers for Environmental Prediction Reanalysis 2 (NCEP-2) and the European Centre for Medium-Range Weather Forecasts 40 Year Re-analysis (ERA-40).
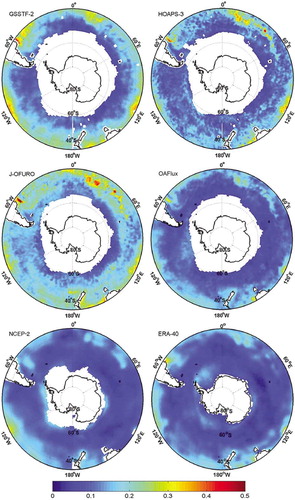
Fig. 16 The linear trends of annual mean sea-air specific humidity difference over the Southern Ocean for the second version of the Goddard Satellite-Based Surface Turbulent Fluxes (GSSTF-2), the third version of the Hamburg Ocean Atmosphere Parameters and Fluxes from Satellite Data (HOAPS-3), Japanese Ocean Fluxes Data Sets with Use of Remote Sensing Observations (J-OFURO), Objectively Analyzed Air–Sea Fluxes for the Global Oceans (OAFlux), National Centers for Environmental Prediction Reanalysis 2 (NCEP-2) and the European Centre for Medium-Range Weather Forecasts 40 Year Re-analysis (ERA-40). Thin black lines indicate regions with correlation coefficients above the 90% confidence level.
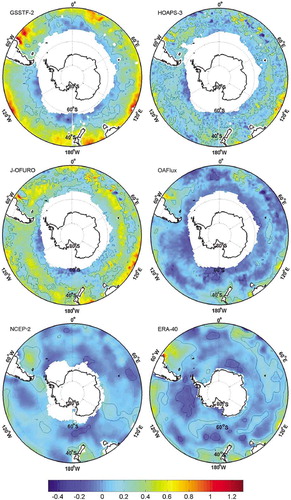
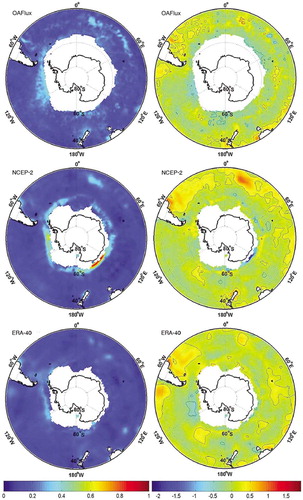
Fig. 17 Standard deviation (left column) and trend (right column) of sea-air temperature difference for Objectively Analyzed Air–Sea Fluxes for the Global Oceans (OAFlux), National Centers for Environmental Prediction Reanalysis 2 (NCEP-2) and the European Centre for Medium-Range Weather Forecasts 40 Year Re-analysis (ERA-40). Thin black lines indicate regions with correlation coefficients above the 90% confidence level.