Figures & data
Fig. 1 The thermal pathways to the North Pole suggested by Bent (1872). (Image libr0568, Treasures of the National Oceanic and Atmospheric Administration Library Collection.)
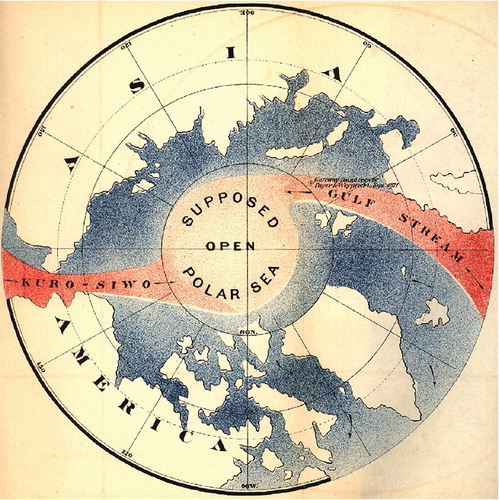
Fig. 2 (a) Temperatures for the Holocene from different data reconstructions. The black line is a composite. (The figure is a modified version of a graphic online at http://commons.wikimedia.org/wiki/File:Holocene_Temperature_Variations.png and created by R.A. Rohde using data from various sources listed on the website.) (b) Extended annual mean surface air temperature (SAT) record for the Atlantic–Arctic boundary region based on composite land station records (Wood et al. Citation2010). Ninety-five percent confidence limits are shown. Decadal-scale variations are emphasized with a two-way Butterworth low-pass filter constructed to remove frequencies higher than 0.1 cycles per year (black line). The early 20th century warming episode and the recent temperature increase are evident. From Wood et al. (2010).
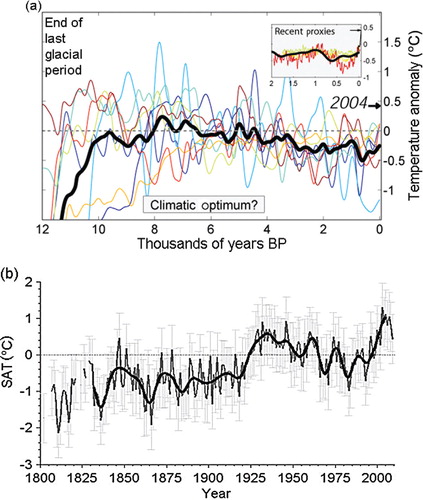
Fig. 3 Sea-ice extent in August 1938 (Thomsen Citation1939). Note the lack of sea ice just north of Svalbard and in the Kara Sea.
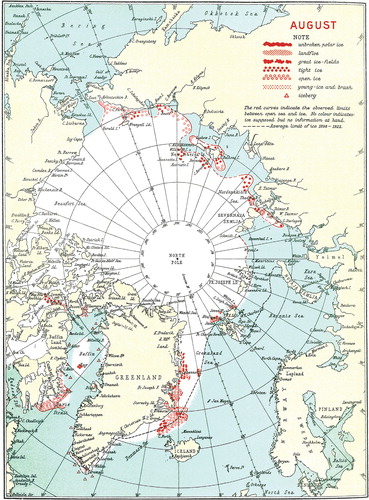
Fig. 4 Near-surface air temperature anomaly multi-year composites (°C) for 2001–10. Anomalies are relative to the 1971-2000 mean and show a strong Arctic amplification of recent temperature trends. Data are from the reanalysis data of the National Centers for Environmental Prediction and the National Center for Atmospheric Research through the National Oceanic and Atmospheric Administration Earth Systems Research Laboratory, generated online at http://www.esrl.noaa.gov/psd/.
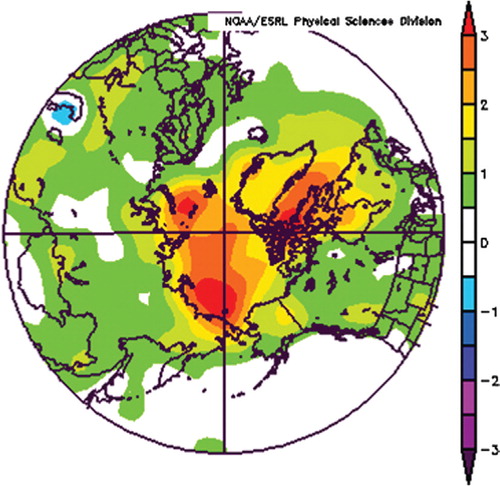
Fig. 5 Sea-ice concentration anomalies in percent for October 2009 showing major relative decreases in sea ice in the northern Chukchi, Laptev and Kara seas. The figure is based on microwave signatures and was obtained online from the National Snow and Ice Data Center at http://nsidc.org/data/seaice_index/archives/index.html.
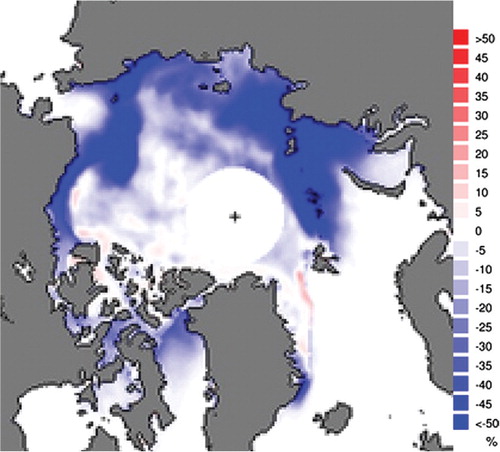
Fig. 6 Sea-ice age (represented by different colours for different years) for the end of April 2010 showing the small extent of sea ice older than three years. Provided by J. Maslanik as an update to Maslanik et al. (Citation2008).
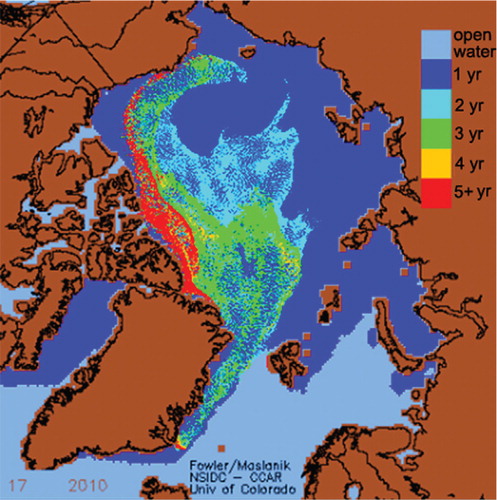
Fig. 7 A representation of the current and future Arctic climate feedbacks. Starting at the top, warming and changes in atmospheric circulation lead to loss of summer sea ice and increased storage of heat in the newly sea ice-free ocean areas. This ocean heat is returned to the lower troposphere in the following autumn, increasing the geopotential height of constant pressure surfaces and thus impacting local and far field winds through teleconnections.

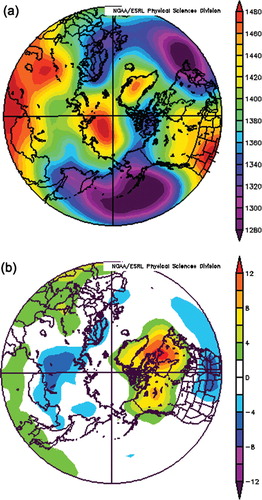
Fig. 8 (a) The climatological 850 mb geopotential height field for December 1968–1996. Low heights over the Arctic are representive of the polar vortex of westerly winds. (b) Similar to (a) but for the observed 850 mb geopotential height field in December 2009. Note the near reversal of the pattern with the highest heights now residing over the Arctic. Air streamlines follow the height contours, showing a connection between the Beaufort Sea region and the eastern United States and that the westerly flow into Europe is strongly displaced to the south. The normal region of the Icelandic Low now actually shows a near maximum. (c) Similar to (b) but showing the anomaly field for the December 850 geopotential height. Heights are displaced upward compared to normal conditions throughout the Arctic. (d) Anomalous zonal wind component for December 2009. The extensive regions of negative values (blue/purple) show the reduction in the normally strong westerly winds in the polar vortex, a major atypical pattern. (e) Temperature anomalies at 850 mb for December 2009. Note the regions of relatively warmer lower tropospheric temperatures around regions of the seaonal ice zones in the Chukchi Sea, north of Svalbard and in Baffin Bay. Note the similarity of the pattern shape to the 850 mb anomalous geopotential height field in (c). (f) A warm Arctic—cold continent pattern for December 2010. (g) The observed 850 mb geopotential height field in December 2010. Data are from the reanalysis data of the National Centers for Environmental Prediction and the National Center for Atmospheric Research through the National Oceanic and Atmospheric Administration Earth Systems Research Laboratory, generated online at http://www.esrl.noaa.gov/psd/.
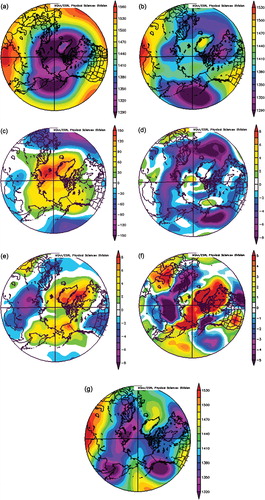
Fig. 9 (a) Air temperature anomalies at 850 mb for December 2008. Note the warm anomalies over the Chukchi and Barents seas and colder temperatures over Canada. (b) Similar to (a) only for the 850 mb geopotential height field. Note the distortion of the polar vortex with north-west winds over northern Canada. Data are from the reanalysis data of the National Centers for Environmental Prediction and the National Center for Atmospheric Research through the National Oceanic and Atmospheric Administration Earth Systems Research Laboratory, generated online at http://www.esrl.noaa.gov/psd/.
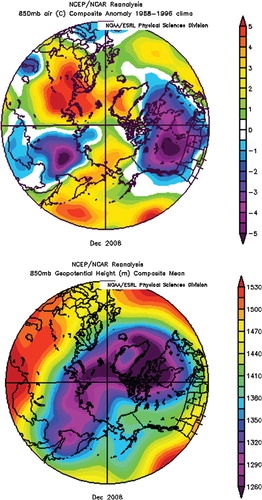
Fig. 10 The 850 mb geopotential height field for December 2007. Data are from the reanalysis data of the National Centers for Environmental Prediction and the National Center for Atmospheric Research through the National Oceanic and Atmospheric Administration Earth Systems Research Laboratory, generated online at http://www.esrl.noaa.gov/psd/.
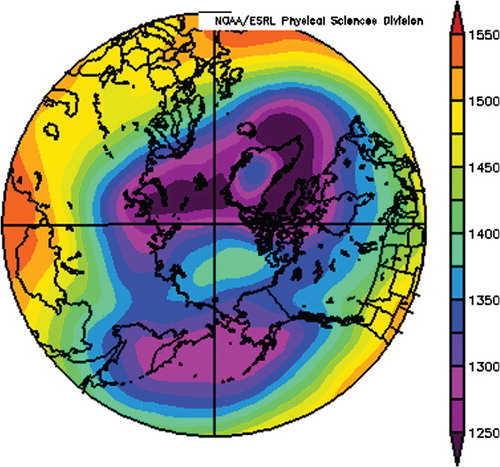
Fig. 11 (a) The 850 mb geopotential height field for February 2010. Again note the anomalous height maxima over the Arctic, the southward displacement of streamline into Europe and the northerly streamline into eastern Asia. Again the Icelandic Low location has a high. (b) The 850 mb temperature anomaly field for February 2010. While the temperature anomalies are now absent over the central Arctic Ocean, there is still the general warm Arctic—cold continents pattern. Data are from the reanalysis data of the National Centers for Environmental Prediction and the National Center for Atmospheric Research through the National Oceanic and Atmospheric Administration Earth Systems Research Laboratory, generated online at http://www.esrl.noaa.gov/psd/.