Figures & data
Fig. 1. Geographical distribution of stations with δ18O data from summer expeditions in 1993, 1995, 2005 and 2006. Also indicated are the Ob and Yenisey rivers in the Kara Sea and the Lena River in the Laptev Sea (an arrowhead marks the major discharge in the Lena Delta).
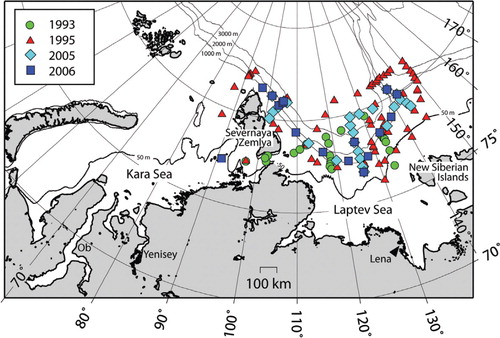
Fig. 2. Property plot of δ18O versus salinity for stations taken in 1993, 1995, 2005 and 2006. A mixing line between values of Atlantic water and Lena River water is indicated.
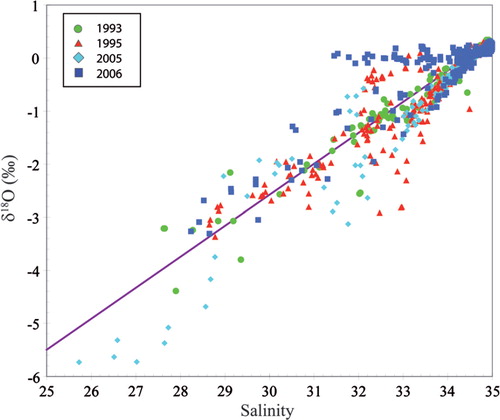
Table 1. End-member values for mass-balance calculations.
Fig. 3. Inventories of (a) sea-ice meltwater and (b) river water for all investigated years. The grey line indicates the 500-m isobath and the position of the continental slope. (c) Final distribution of Lagrangian particles derived from National Centers for Environmental Prediction wind data by applying a simple tracer trajectory numerical model, with particles released daily during June (black dots), July (red dots) and August (green dots), and with the final distribution depicted on 16 September. See text for further explanation.
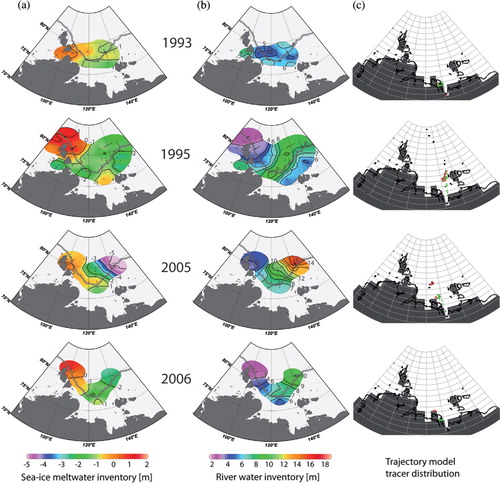
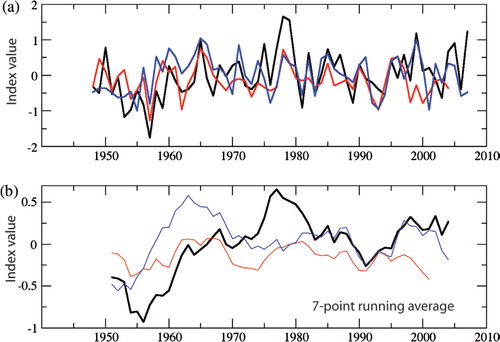
Fig. 4. Comparison between our normalized trajectory index calculated from model results with 3% (light green) and 7% (dark green) atmospheric wind forcing and the vorticity index (red line; inverted values). See text for further explanation.
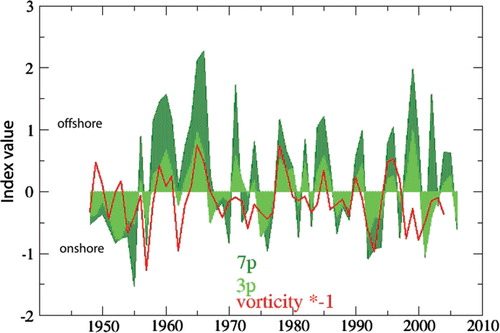
Fig. 5. (a) Series of monthly averaged National Centers for Environmental Prediction 10-m winds (given in m s−1) with an offshore wind setting in June and July, and with the opposite wind direction during September. The sea-level pressure from June to September 1999 is indicated by the coloured shading. Note the different scaling of the sea-level pressure (SLP) colour bar. (b) Variability of wind direction and velocity from a 10-m elevation in m s−1 during summer 1999. The left panel shows the zonal wind component at 75°N (10-m u-wind) and the middle panel shows the meridional wind component at 75°N (10-m v-wind), where positive values indicate eastward and northward directions, respectively. The right panel shows the final positions of Lagrangian particles deployed in June (black dots), July (red dots) and August (green dots) on 16 September 1999. See text for further explanation. (c) Temperature and salinity data on an oceanographic section roughly along 130°E latitude as well as the surface salinity distribution in September 1999.
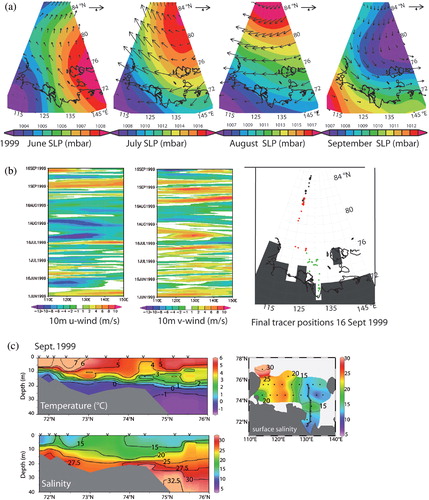
Table 2. Summary of river inventories and river budgets calculated for both years over the reference area between 135°E and 150.15°E, and 78.8°N and 81.2°N (77 822 km2). See text for further explanation.
Fig. 6. Empirical orthogonal function (EOF) patterns for sea-level pressure (SLP) summer data presented as correlation maps between the expansion coefficient time series and SLP data for (a) the second EOF and (b) the third EOF. See text for further explanation. Average June–August SLP anomalies (difference to the climatological mean for summers from 1948 to 2007) during (c) onshore years and (d) offshore years.
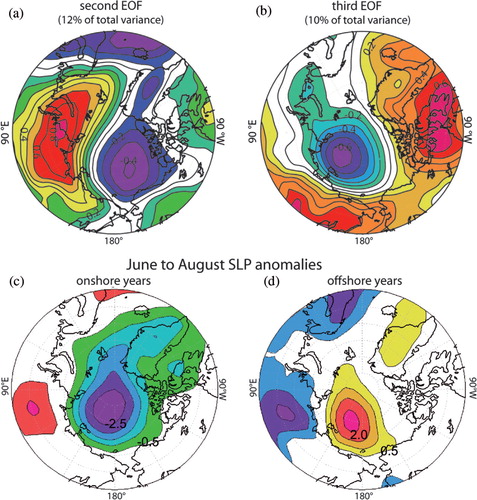
Fig. 7. (a) Comparison between the trajectory index (blue), the inverted vorticity index (red) and (b) the inverted principle component time series from the third empirical orthogonal function of summer sea-level pressure data (black) north of 50°N. (b) Seven-point running average for the curves displayed in (a).