Figures & data
Fig. 1. Area of investigation: the archipelago of Svalbard between 74° and 81°N and 10° and 35°E, for the purpose of this study subdivided into regions R1–R7. About 60% (3.6×10⁴ km2) of the total land surface is glaciated with most continuous ice coverage to be found in north-eastern regions (R6 and R7). The location of automatic weather stations (AWS) on Nordaustlandet is shown.
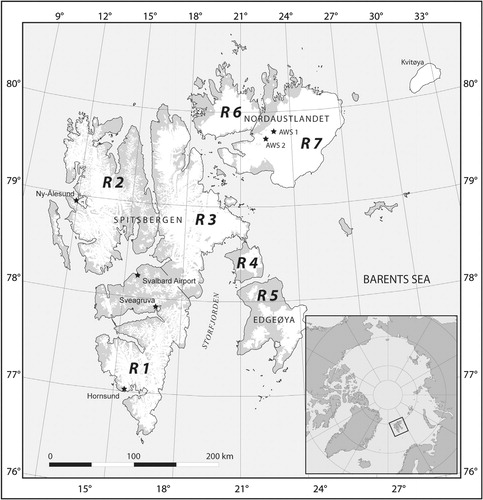
Table 1. Meteorological data available for calibrating and validating the melt analysis of this study.
Fig. 2. Nine-year time series (2000–08) of the average backscattering (σomean) for all ice-covered areas within Region 1 and Region 2 (for boundaries see Fig. 1) compared to corresponding temperature records from local weather stations.
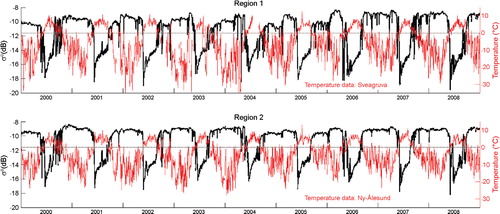
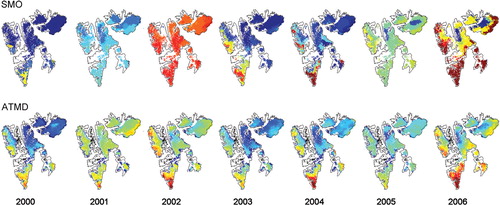
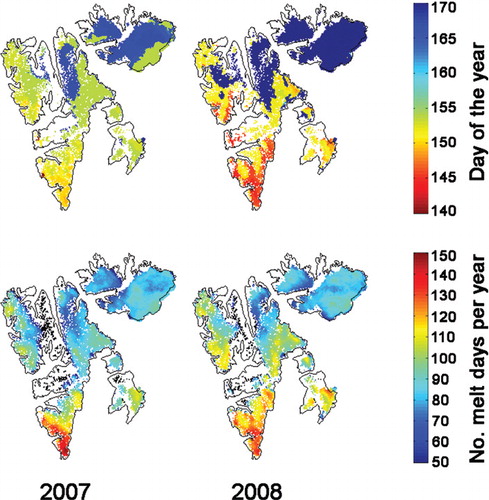
Fig. 4. Mean and standard-deviation patterns of (a) annual total number of melt days (ATMD) and (b) summer melt onset (SMO) with respect to the 2000–08 period of observation.
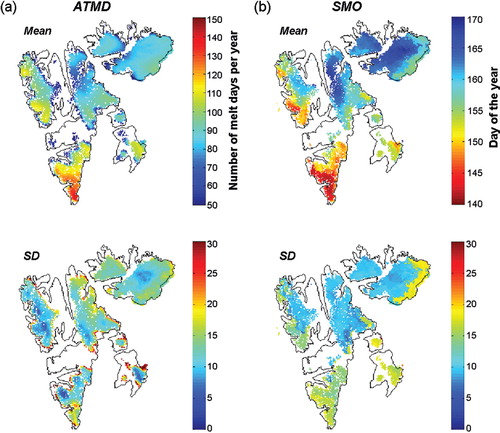
Fig. 5. Svalbard annual total number of melt days (ATMD) and summer melt onset (SMO) anomalies relative to the 2000–08 average.
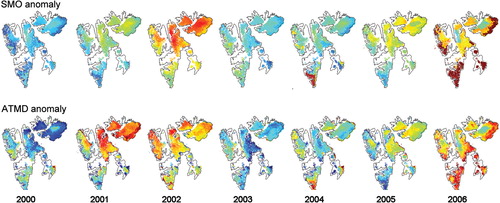
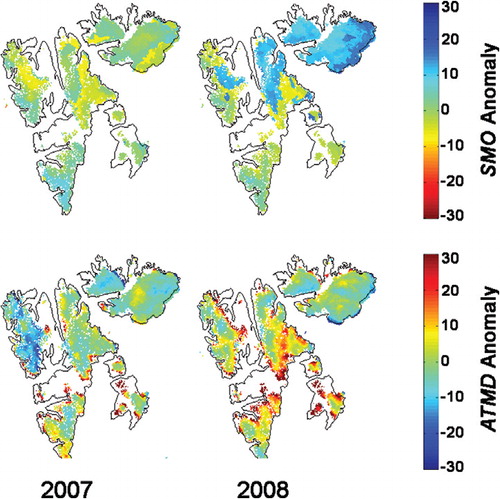
Fig. 6. Regional averages of (a) annual total number of melt days (ATMD) and (b) summer melt onset (SMO) from 2000 to 2008.
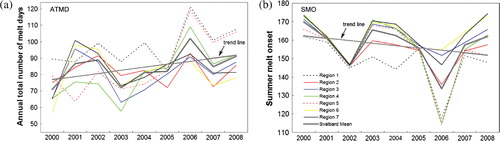
Table 2. Regional annual total number of melt days and summer melt onset from 2000 to 2008.
Fig. 7. Average QuikSCAT backscatter response for Region 1 in (a) 2000 and (b) 2006 compared to air temperature and precipitation data from local weather stations.
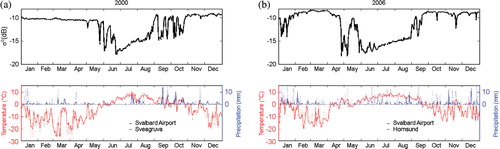
Fig. 8. Synchronous melt onset over all of Svalbard: (a) σomean-time series for seven Svalbard regions in 2001, and (b) US National Centers for Environmental Prediction and US National Center for Atmospheric Research (NCEP/NCAR) maps of air-temperature fields from 9 to 15 June 2001.
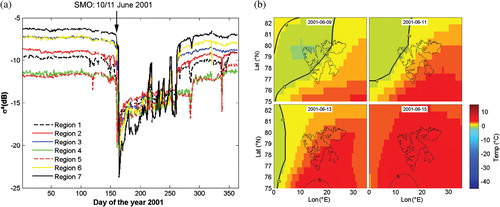
Fig. 9. Regional σomean as a function of elevation and time for all regions in (a) 2001, (b) 2006 and (c) from January 2000 to December 2008 in Region 3.
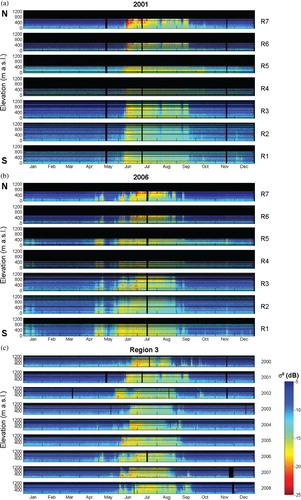
Fig. 10. SMO as derived from albedo studies (filled dots) presented by Winther et al. (2002), and from QuikSCAT backscatter signature (circles) at Ny-Ålesund.
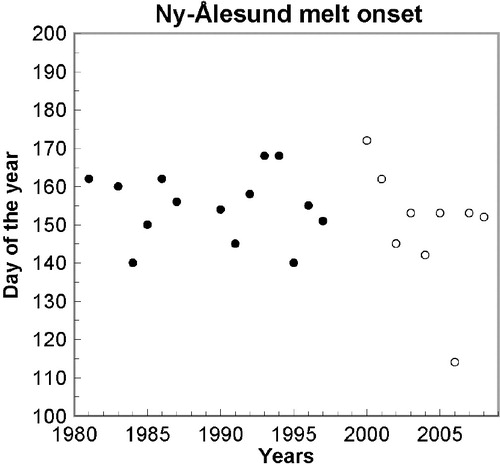
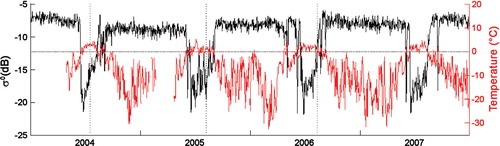
Fig. 11. Comparison of daily backscatter and air temperature measurements from 2004–08 at Austfonna summit. Horizontal lines mark σoTr in each year.
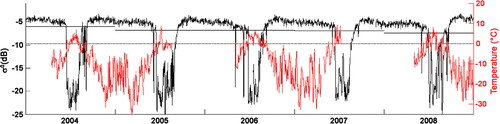
Fig. 12. Comparison of daily air temperatures and corresponding QuikSCAT-backscatter time series from 2004 to 2007 at the location of automatic weather station 1 (AWS 1) on Etonbreen, Austfonna. Vertical lines mark dates at which winter snow had disappeared and bare ice was exposed at the surface according to local sonic ranger measurements.