Figures & data
Fig. 1. Moderate Resolution Imaging Spectroradiometer channel 1 image of the Laptev Sea for 22 April 2008, 1055 UTC. The area enclosed by a black solid line denotes the Laptev Sea polynya mask (LAP). The polynyas can be seen as a dark narrow band along the landfast-ice edge (see ). The black-dashed rectangle borders the core model domain of the two Finite Element Sea-Ice Ocean Model versions, FESOM-HR and FESOM-FI.
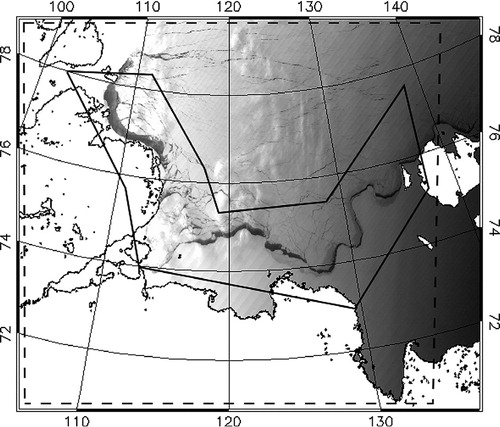
Fig. 2. Landfast-ice masks derived from Moderate Resolution Imaging Spectroradiometer surface temperatures for December 2007 to April 2008. Contour lines show 25- and 30-m isobaths. Black-bordered areas show the different Laptev Sea polynya subsets: the north-eastern Taimyr polynya (NET), the Taimyr polynya (T), the Anabar–Lena polynya (AL) and the western New Siberian polynya (WNS).
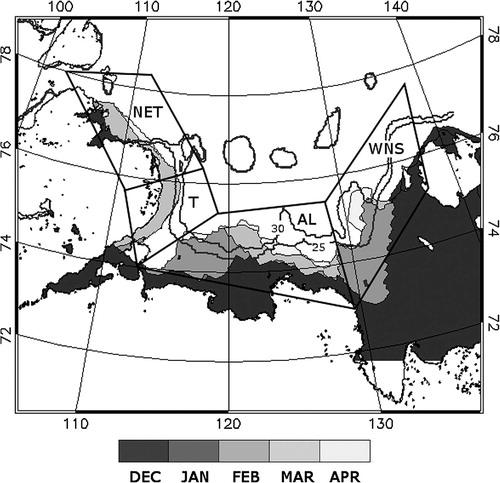
Table 1. Specifications of the data sets used in this study: two versions of the North Atlantic–Arctic Ocean–Sea-Ice Model (NAOSIM and NAOSIM-FI); three versions of the Finite Element Sea-Ice Ocean Model (FESOM, FESOM-CR and FESOM-FI); the Advanced Microwave Scanning Radiometer–Earth Observing System (AMSR-E) satellite data and the Polynya Signature Simulation Method (PSSM) data.
Fig. 3. Time series of open-water areas (OWA) for the whole polynya system (LAP) and the individual Laptev Sea sub-polynyas (see ). Open-water areas are calculated from ice concentrations of: (a) the North Atlantic–Arctic Ocean–Sea-Ice Model (OWANAOSIM) and another version of this model, the NAOSIM-FI (OWANAOSIM-FI) from 1 November 2007 to 11 May 2008 and (b) the coarse-resolution version of the Finite Element Sea-Ice Ocean Model (OWAFESOM-CR) from 1 November 2007 to 11 May 2008 and two other versions of the FESOM model, FESOM-HR (OWAFESOM-HR) and FESOM-FI (OWAFESOM-FI) from 1 April to 11 May 2008. Open-water areas derived from Advanced Microwave Scanning Radiometer–Earth Observing System (AMSR-E) data (OWAAMSR-E) are shown in (a) and (b). Vertical lines mark polynya events.
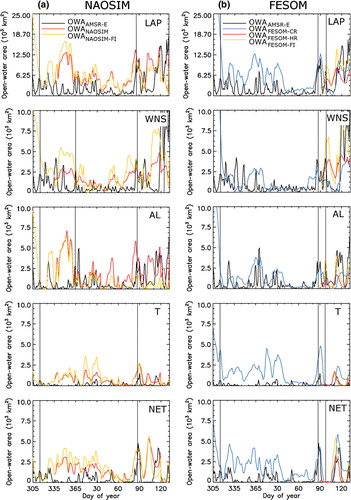
Table 2. Mean, standard deviation (SD) and correlation coefficients (r) of the different open-water area (OWA) time series for all polynya subsets for the period from 1 November 2007 to 11 May 2008 and 1 April to 11 May 2008. Mean and SD of open-water area of (a) the Advanced Microwave Scanning Radiometer-Earth Observing System (AMSR-E), (b) the two versions of the North Atlantic–Arctic Ocean–Sea-Ice Model (NAOSIM and NAOSIM-FI) and (c) the three versions of the Finite Element Sea-Ice Ocean Model (FESOM-CR, FESOM-HR and FESOM-FI). Correlation coefficients between results derived from AMSR-E and NAOSIM/NAOSIM-FI are presented in (b). AMSR-E and FESOM-CR/FESOM-HR/FESOM-FI correlations are presented in (c). Correlations significant at the 95% confidence level (t-test) are in boldface.
Fig. 4. Time series of polynya areas (POLA) for winter season 2007/08 in the WNS (eastern Laptev Sea) and NET (western Laptev Sea) polynyas (see Fig. 2). Polynya areas are calculated from ice concentrations of (a) the North Atlantic–Arctic Ocean–Sea-Ice Model (POLANAOSIM) and another version of this model, the NAOSIM-FI (POLANAOSIM-FI) from 1 November 2007 to 11 May 2008 and (b) the coarse-resolution Finite Element Sea-Ice Ocean Model (POLAFESOM-CR) from 1 November 2007 to 11 May 2008 and two other versions of the FESOM model, FESOM-HR (POLAFESOM-HR) and FESOM-FI (POLAFESOM-FI) from 1 April to 11 May 2008. Polynya areas derived from Advanced Microwave Scanning Radiometer–Earth Observing System (AMSR-E) data (POLAAMSR-E) and the Polynya Signature Simulation Method (POLAPSSM) are shown in (a) and (b). After day 319 (vertical line) FESOM-CR shows no polynya area. The vertical line at day 99 marks an overestimation of FESOM-FI open-water area. Vertical line at day 121 in WNS marks a polynya event.
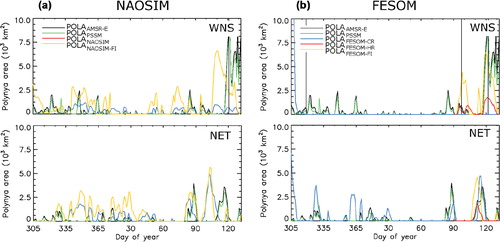
Table 3. Mean, standard deviation (SD) and correlation coefficients (r) of the different polynya area (POLA) time series for the western New Siberian polynya (WNS) and north-eastern Taimyr polynya (NET) for the period from 1 November 2007 to 11 May 2008 and 1 April to 11 May 2008. Mean and SD of polynya area of (a) the Advanced Microwave Scanning Radiometer-Earth Observing System (AMSR-E) and the Polynya Signature Simulation Method (PSSM), (b) the two versions of the North Atlantic–Arctic Ocean–Sea-Ice Model (NAOSIM and NAOSIM-FI) and (c) the three versions of the Finite Element Sea-Ice Ocean Model (FESOM-CR, FESOM-HR and FESOM-FI). Correlation coefficients between results derived from AMSR-E and PSSM are presented in (a). AMSR-E and NAOSIM/NAOSIM-FI correlation are presented in (b). AMSR-E and FESOM-CR/FESOM-HR/FESOM-FI correlation are presented in (c). Correlations significant at the 95% confidence level (t-test) are in boldface.
Fig. 5. Maps of sea-ice concentration (SIC) on 29 April 2008 derived from (a) Advanced Microwave Scanning Radiometer–Earth Observing System (AMSR-E) data, (b) the North Atlantic–Arctic Ocean–Sea-Ice Model (NAOSIM) and (c) another version of this model, NAOSIM-FI. In (a) and (b) yellow–green features denote the polynyas, light orange features indicate leads. Plots showing the difference that results when (d) NAOSIM and (e) NAOSIM-FI simulations are subtracted from the AMSR-E sea-ice concentration.
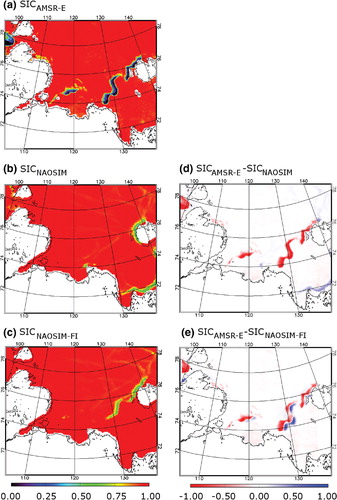
Fig. 6. Maps of sea-ice concentration (SIC) on 29 April 2008 derived from (a) the coarse-resolution Finite Element Sea-Ice Ocean Model (FESOM-CR); and two other versions of this model, (b) FESOM-HR and (c) FESOM-FI. Plots showing the difference that results when (d) FESOM-CR, (e) FESOM-HR and (f) FESOM-FI simulations are subtracted from the AMSR-E sea-ice concentration (compare to Fig. 5a).
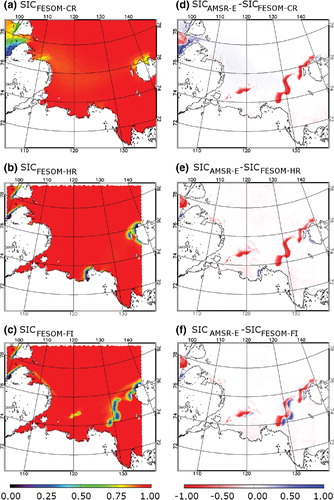
Fig. 7. Sea-ice concentrations derived from the NAOSIM-FI version of the North Atlantic–Arctic Ocean–Sea-Ice Model are examined in terms of the occurrence of leads. The criterion is the 70% sea-ice concentration threshold that is also used for the classification of polynyas and includes open water and thin ice up to 0.2-m thickness (CitationWillmes et al. 2010). Pixels with a sea-ice concentration below 70% are counted from 1 December 2007 to 11 May 2008. The map shows the frequency (%) of these pixels in the period in question. The darker grey areas along the fast-ice edge indicate polynyas. The lighter grey areas indicate simulated leads not attached to the fast-ice edge but located in the defined polynya regions. Black boxes indicate the polynya regions (see ).
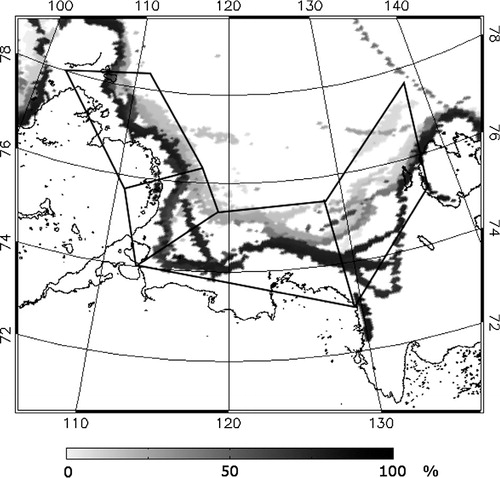
Table 4. Comparison of sea-ice concentrations (SIC) and polynya features simulated by the five different model runs: two versions of the North Atlantic–Arctic Ocean–Sea-Ice Model (NAOSIM) and three versions of the Finite Element Sea-Ice Ocean Model (FESOM).