Figures & data
Fig. 1 (a) Laptev Sea bathymetry, derived from the International bathymetric chart of the Arctic Ocean (Jakobsson et al. Citation2008). The fast-ice extents in December 2007 (solid red line) and in May 2008 (dashed red line) determine the position of the mid-shelf flaw polynya. Locations of the mooring stations Anabar (A) and Khatanga (K) are shown. The distance from the fast ice edge to the mooring stations changes from about 100 to 20 km, while the distance to the furthermost Advanced Synthetic Aperture Radar (ASAR) tracking point changes from about 300 to 250 km during the winter. The black dashed square represents the area of the ASAR image in (b). (b) ASAR satellite image from 30 April 2008 showing the fast ice in the south-eastern Laptev Sea. The Lena Delta is at the bottom of the image. An advanced flaw polynya with low backscatter values in the open-water area (dark area) developed at the fast-ice edge (dashed red line). The high backscatter values (bright area) in the polynya indicate presence of newly formed ice.
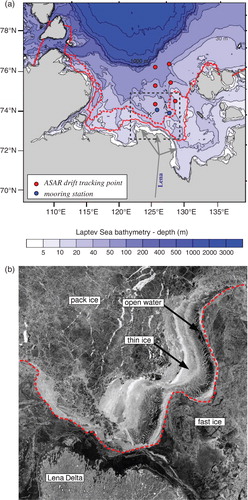
Table 1 The overview of the data sets used in the validation.
Fig. 2 Scatter plots of sea-ice drift speed and direction at the Anabar and Khatanga mooring locations for the period from November 2007 to May 2008 derived from upward-looking 300 kHz acoustic Doppler current profilers (ADCP) compared to the following data sets: Advanced Synthetic Aperture Radar (ASAR) images, the French Research Institute for Exploitation of the Sea product (IFREMER) processed from pairs of Advanced Microwave Scanning Radiometer Earth Observing System/Aqua images and observational data from the European Organization for the Exploitation of Meteorological Satellites Ocean and Sea Ice Satellite Application Facility (OSI-SAF). Each plot shows the number of data pairs in the analysis (N), the correlation value (R), the statistical bias (bias), the variance ratio (F) and the standard error deviation (SE). Speed units are m/s and direction values are degrees. All correlations shown are statistically significant at the 99% confidence level (probability value less than 0.001).
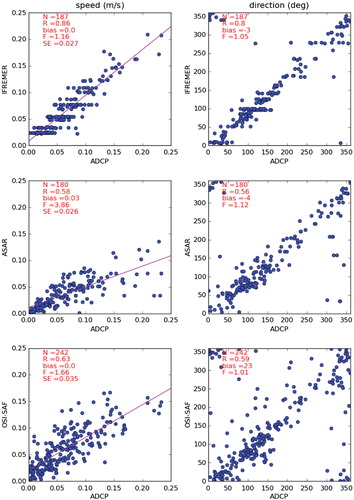
Table 2 The validation results of the drift vector components of the satellite products and model simulations with the in situ measurements for the Laptev Sea mid-shelf in winter 2007/2008.
Fig. 3 Scatter plots of sea-ice drift speed and direction in the outer shelf for the period from November 2007 to May 2008 using the following data sets: Advanced Synthetic Aperture Radar (ASAR) images, the French Research Institute for Exploitation of the Sea product (IFREMER) processed from pairs of Advanced Microwave Scanning Radiometer Earth Observing System/Aqua images and observational data from the European Organization for the Exploitation of Meteorological Satellites Ocean and Sea Ice Satellite Application Facility (OSI-SAF). Each plot shows the number of data pairs in the analysis (N), the correlation value (R), the statistical bias (bias), the variance ratio (F) and the standard error deviation (SE). Speed units are m/s and direction values are degrees. All correlations shown are statistically significant at the 99% confidence level (probability value less than 0.001).
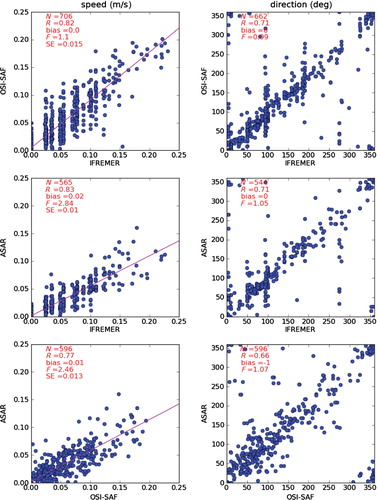
Fig. 4 (a) Sea-ice drift speed and (b) direction without (red line) and with (dashed red line) integrated fast ice derived from two versions of the North Atlantic–Arctic Ocean–Sea-Ice Model (NAOSIM and NAOSIM-FI) and the following observational and remote-sensing data sets for the Khatanga mooring location from 15 October 2007 to 15 May 2008: upward-looking 300 kHz acoustic Doppler current profilers (ADCP), Advanced Synthetic Aperture Radar (ASAR) images, the French Research Institute for Exploitation of the Sea product (IFREMER) processed from pairs of Advanced Microwave Scanning Radiometer Earth Observing System/Aqua images and observational data from the European Organization for the Exploitation of Meteorological Satellites Ocean and Sea Ice Satellite Application Facility (OSI-SAF). The grey-filled rectangle in (a) marks speeds that were not included in the directional correlation analysis.
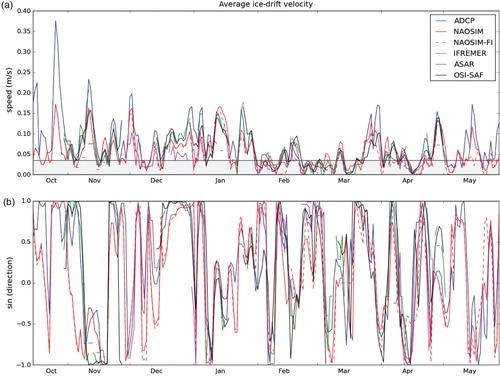
Fig. 5 (a) Sea-ice drift speed and (b) direction without (red line) and with (dashed red line) integrated fast ice derived from two versions of the North Atlantic–Arctic Ocean–Sea-Ice Model (NAOSIM and NAOSIM-FI) and the following observational and remote-sensing data sets for a point on the outer shelf (77°N, 125°E) from 15 October 2007 to 15 May 2008: Advanced Synthetic Aperture Radar (ASAR) images, the French Research Institute for Exploitation of the Sea product (IFREMER) processed from pairs of Advanced Microwave Scanning Radiometer Earth Observing System/Aqua images, and observational data from the European Organization for the Exploitation of Meteorological Satellites Ocean and Sea Ice Satellite Application Facility (OSI-SAF).The grey-filled rectangle in (a) marks speeds that were not included in the directional correlation analysis.
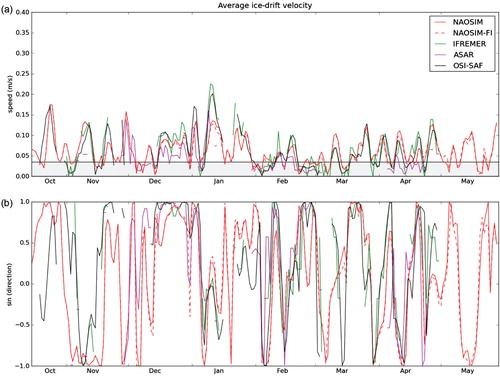
Fig. 6 Scatter plots of sea-ice drift speed and direction at the Anabar and Khatanga mooring locations as simulated with the fast ice by the North Atlantic–Arctic Ocean–Sea-Ice Model (NAOSIM) for the period from November 2007 to May 2008 compared to the following data sets: upward-looking 300 kHz acoustic Doppler current profilers (ADCP), Advanced Synthetic Aperture Radar (ASAR) images, the French Research Institute for Exploitation of the Sea product (IFREMER) processed from pairs of Advanced Microwave Scanning Radiometer Earth Observing System/Aqua images and observational data from the European Organization for the Exploitation of Meteorological Satellites Ocean and Sea Ice Satellite Application Facility (OSI-SAF). Blue dots are data points included in the statistical analysis. The points with drift speed under 0.035 m/s at the drift direction scatter plots are marked by green dots. Each plot shows the number of data pairs in the analysis (N), the correlation value (R), the statistical bias (bias), the variance ratio (F) and the standard error deviation (SE). Speed units are m/s and direction values are degrees. All correlations shown are statistically significant at the 99% confidence level (probability value less than 0.001). Numbers in red (black) show the statistical characteristics of the model simulations with (without) the fast ice.
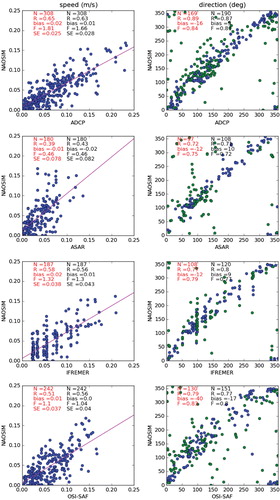
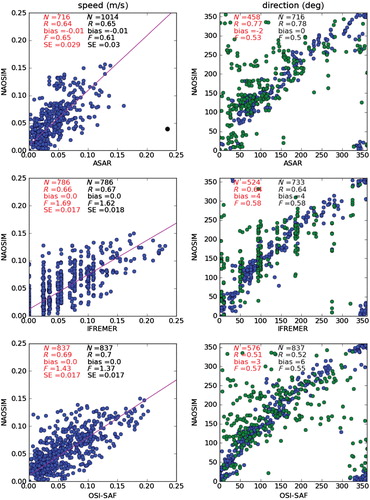
Fig. 7 Scatter plots of sea-ice drift speed and direction at in the outer shelf as simulated by the North Atlantic–Arctic Ocean–Sea-Ice Model (NAOSIM) for the period from November 2007 to May 2008 compared to the following data sets: Advanced Synthetic Aperture Radar (ASAR) images, the French Research Institute for Exploitation of the Sea product (IFREMER) processed from pairs of Advanced Microwave Scanning Radiometer Earth Observing System/Aqua images, and observational data from the European Organization for the Exploitation of Meteorological Satellites Ocean and Sea Ice Satellite Application Facility (OSI-SAF). Model simulation with the fast ice and observational data comparison from November 2007 to May 2008. Blue dots are data points included in the statistical analysis. Green dots are points with drift speed under 0.035 m/s. Each plot shows the number of data pairs in the analysis (N), the correlation value (R), the statistical bias (bias), the variance ratio (F) and the standard error deviation (SE). Speed units are m/s and direction values are degrees. All correlations shown are statistically significant at the 99% confidence level (probability value less than 0.001). Numbers in red (black) show the statistical characteristics of the model simulations with (without) the fast ice.