Figures & data
Fig. 1 Ice Complex deposits (ground ice) exposed at the coast of the Bykovsky Peninsula. Note the thermo-erosional notch at the land–water interface, highlighted by white arrows.

Fig. 2 Study area: the Bykovsky Peninsula is located near to the mouth of the Lena River and forms a natural protection for the harbour of Tiksi (1969 Corona KH-4 imagery).
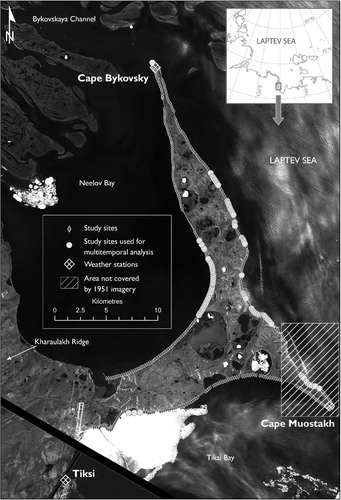
Fig. 3 Subaqueous setting of the study area. The Bykovsky Peninsula is surrounded by fairly shallow waters with depths exceeding 10 m only in the Tiksi Bay and at the outlet of the Bykovskaya Channel.
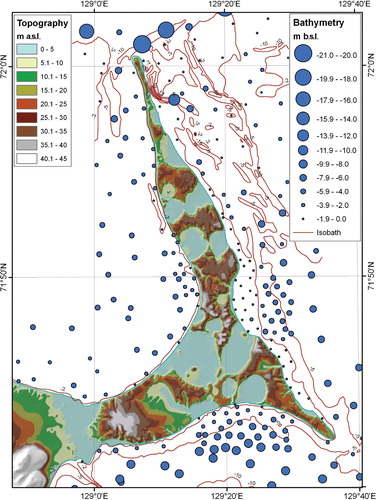
Fig. 4 Sea bottom water temperature and conductivity (which corresponds with salinity) in 7 m water depth 4.5 km from the eastern shore of Bykovsky Peninsula. The thin dashed line indicates surface water temperatures of the Lena measured on the 10th, 20th and 30th of the month during the ice-free season over a 41-year period. The arrows indicate the axes of reference for conductivity (black arrow) and water temperature (grey arrow).
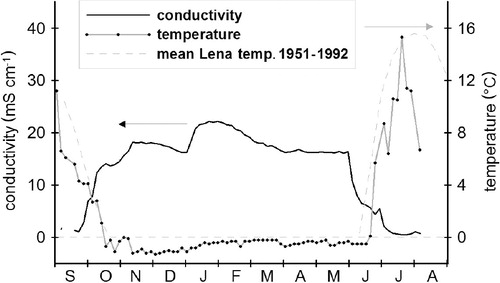
Table 1 Imagery used in the study. All scenes have been resampled to a 2.5 m spatial resolution.
Table 2 Imagery georeferencing and dilution of accuracy (DOA) for the 96 subsampled points used in the temporal analysis. The periods for which the margin of error is greater than 25% of the measured average rate are in boldface.
Fig. 5 Statistical distribution of shore orientation of the study sites. White areas refer to the number of sites used to compile rates for multiple periods. The number of multi-temporal sites is smaller because of the necessity of using sites characterized by large erosion rates to compute erosion rates over shorter periods of time.
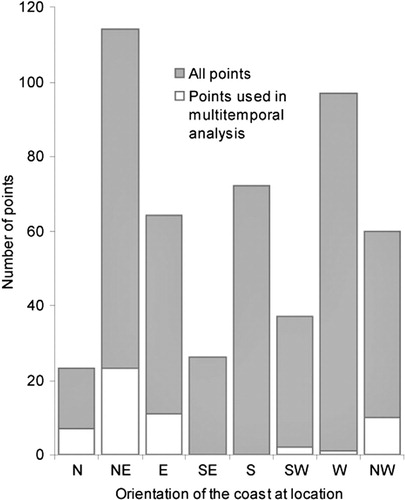
Fig. 6 Statistical distribution of erosion rates in classes of erosion strength (m/yr).
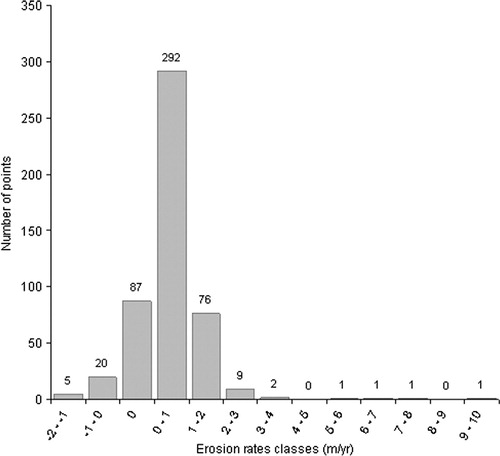
Fig. 7 Erosion rate strength (m/yr) and variability depending on shore orientation. The division by quartiles illustrate the large variability in the observed erosion rates.
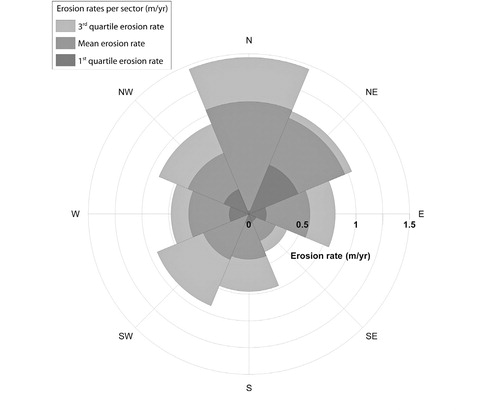
Fig. 8 Coastal erosion rates on the shores of the Bykovsky Peninsula.
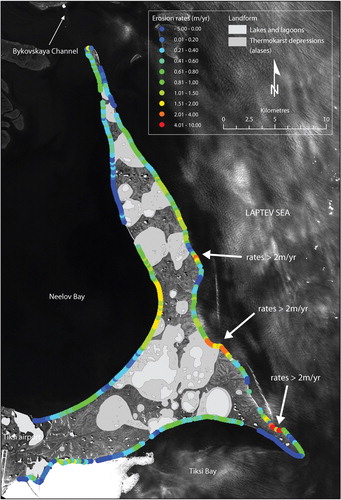
Fig. 9 Coastal types on the shores of the Bykovsky Peninsula.
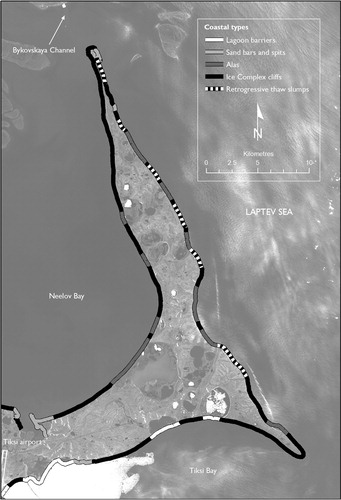
Fig. 10 Retrogressive thaw slump on the coast of the Bykovsky Peninsula. The picture is taken from the edge of the slump. Note the presence of Baydzarakhs (earth mounds left in place after melting of coalesced ice wedges) within the slump floor. A man in the background gives the scale of the headscarp and is indicated by the black arrow.
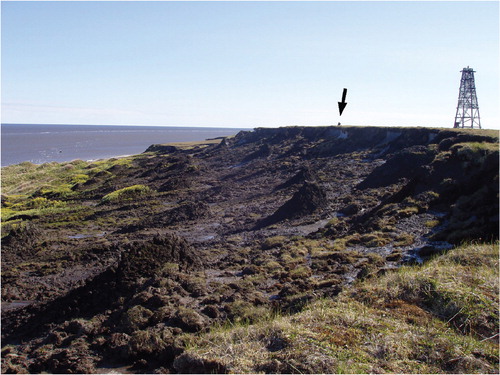
Fig. 11 Coastline in alas north of Mamontovy Khayata on the eastern shore of the Peninsula. The peat-rich alas low grounds are rapidly eroded by incident wave attack.
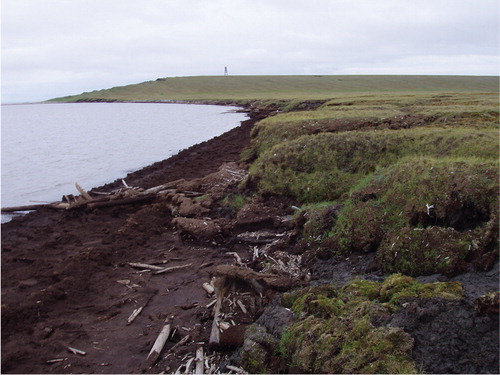
Fig. 12 Erosional sequence on an alas shoreline in the south-east part of the Peninsula. Alas is on the seaward side of the edge. The current shoreline is close to the edge of the alas, which should result in a significant decrease in coastal erosion rates on this stretch of coastline.
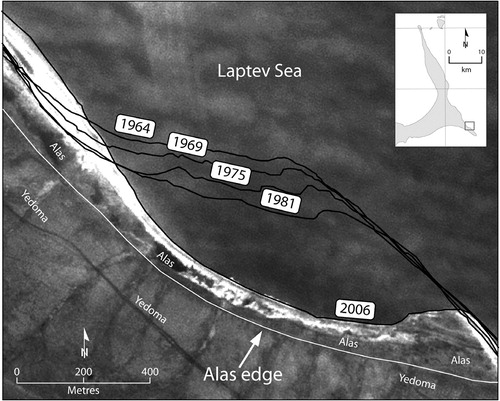
Table 3 Erosion rates and coastal types.
Fig. 13 Temporal evolution of coastal erosion. Two data sets are presented in this figure. One shows all periods investigated in this study (grey bars) and the other shows the same data without the 1986 date, which is based on a low resolution image (line).
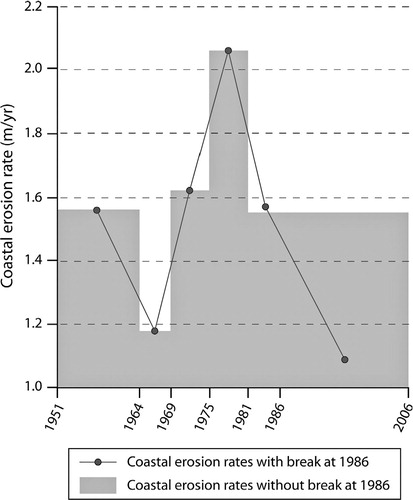
Fig. 14 Temporal evolution of storminess at the Tiksi station, 1958–2006. The histogram bars represent storm count.
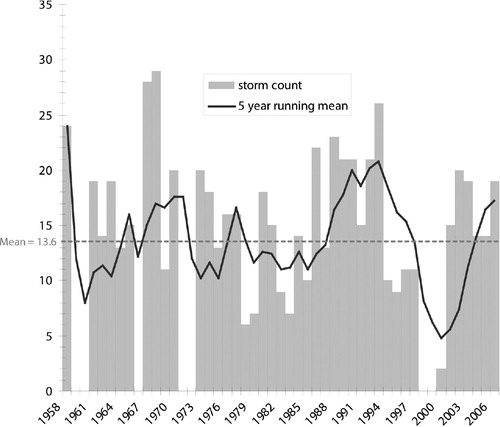
Fig. 15 Spatial distribution of storm wind directions recorded at the Tiksi station over the period 1958–2006. The radius represents storm count.
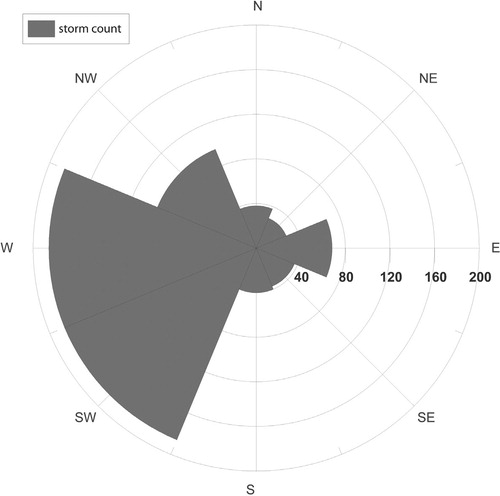
Table 4 Direction of storms for the 1958–1986 and 1987–2006 periods and for the 25% strongest storms that occurred over the 1958–2006 period.