Figures & data
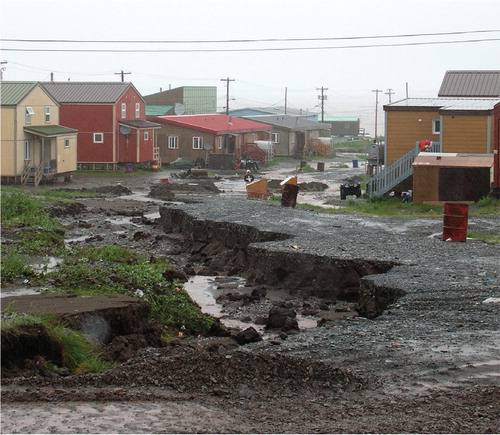
Fig. 1. Map showing the location of Kugluktuk, NU.
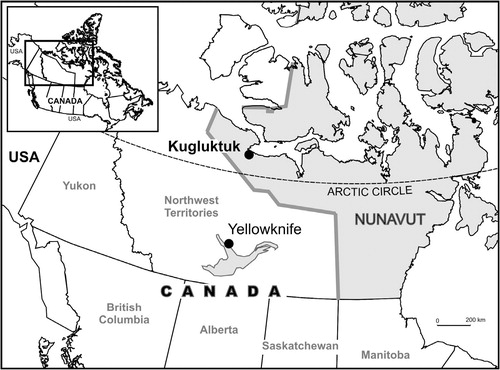
Fig. 2. Average monthly precipitation and temperature at Kugluktuk, NU, for the period 1971–2000. (Source: Environment Canada 2010.)
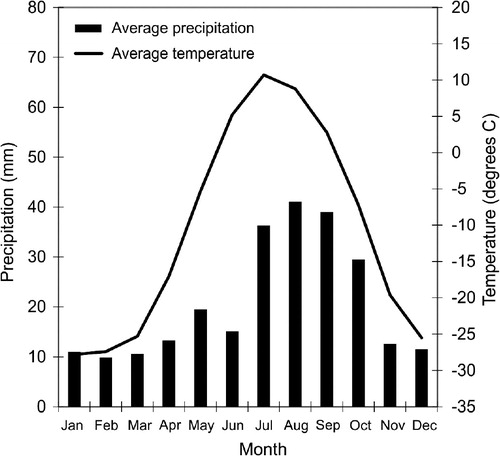
Table 1. Major interview themes and example questions asked under each theme.
Table 2. Summary of exposure-sensitivities, adaptations and key remaining vulnerabilities, Kugluktuk, NU.
Fig. 3. The last day with snow on the ground in Kugluktuk, NU, for the period 1978–2007. (Source: Environment Canada 2010.)
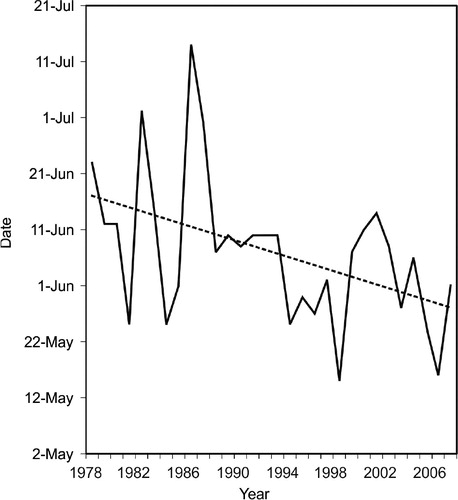
Fig. 4. Wind direction by percentage for winter season (October–April) in Kugluktuk, NU, for the period 1978–79 to 2006–07. (Source: Environment Canada 2010.)
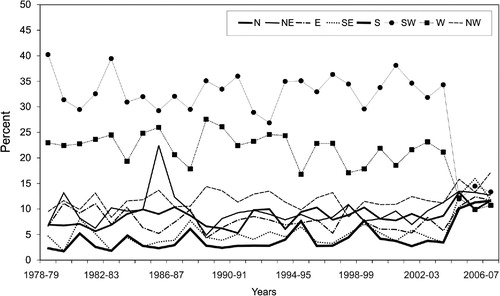
Fig. 5. Road and culvert erosion in Kugluktuk, NU, following a storm on 20–21 July 2007.