Figures & data
Fig. 1 General map of Antarctic Peninsula region and (inset) map of the region between Marguerite Bay and Alexander Island, indicating locations referred to in the text.
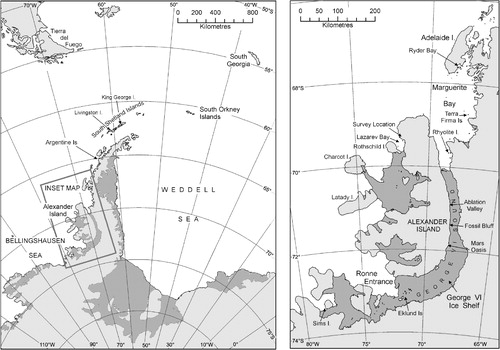
Fig. 2 Flowering plants at the new southern limit of their global distribution. (a) Oblique aerial photograph of the un-named peninsula on north-west Alexander Island. (b) Example of a well-developed grass sward found during the survey. (c) Example of a mixed community with both species of flowering plant, including fruiting Colobanthus quitensis. (d) Polytrichum strictum peat bank of >30 cm depth.
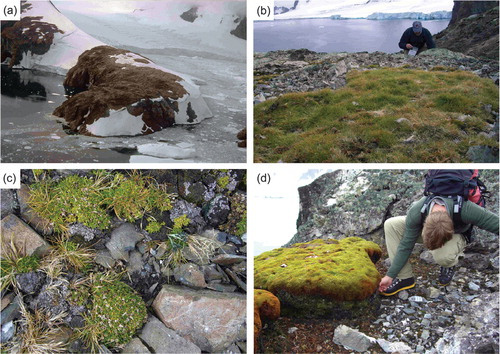
Table 1 Bryophytes recorded from the un-named peninsula in Lazarev Bay, north-west Alexander Island, during the current survey.
Fig. 3 Summary of radiocarbon (14C) and lead isotope (210Pb) chronological data for the Polytrichum strictum peat monolith obtained from Lazarev Bay. Radiocarbon data have depth errors of ±0.25 cm; Pb-210 depth errors are ±1 cm; methods and calibration as described in Tables 2 and 3.
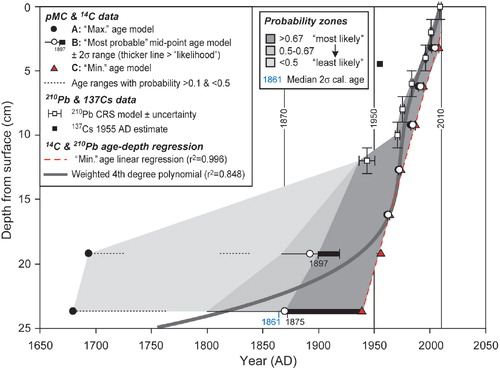
Table 2 Radiocarbon age data for the Lazarev Bay Polytrichum strictum peat monolith. Summary of methods: samples of P. strictum were removed from seven points in the frozen peat below the green zone at ca. 2 cm depth using sterile disposable scalpels. Samples were sent to Beta Analytic (Miami, FL) for accelerator mass spectrometry (AMS) radiocarbon dating, where standard radiocarbon dating procedures were used. Samples were gently crushed and dispersed in de-ionized water, followed by a hot HCl acid wash and a NaOH alkali wash to remove carbonates and secondary organic acids, with a final acid rinse to neutralize the resulting solution; absolute percentage of modern carbon (pMC) data were corrected according to 13C/12C isotopic ratios from measured pMC, where the “modern” (i.e., 1950) pMC value is 100 and the present day (2010) pMC value is 107.5.
Table 3 Calibrated radiocarbon age data for the Lazarev Bay Polytrichum strictum peat monolith. Calibration: samples were calibrated using CALIBomb SH1, a compilation of Southern Hemisphere data sets (Hua & Barbetti Citation2004), from absolute percentage of modern carbon (pMC) data, corrected according to 13C/12C isotopic ratios from measured pMC, and where the “modern” (i.e., 1950) pMC value is 100 and the present day (2010) pMC value is 107.5. Radiocarbon age data were initially calibrated using the CALIB v6 SHCAL04 Southern Hemisphere atmosphere data set. This is applicable directly to samples <1175 14C yr BP and has an average offset of 43±13 years from the INTCAL09 data set. For samples >ca. 1 ky BP, a random effects model is used to account for variation in this offset through time compared to the INTCAL09 calibration data set (McCormac et al. Citation2004; Reimer et al. Citation2009; http://calib.qub.ac.uk/calib/calib.html). Calibrated ages have been rounded to the nearest year, which may be too precise; hence, likely ages have been rounded to the nearest five years in the discussion. Results from the INTCAL09 calibration were compared to the CALIB v6 SHCAL04. The latter has fewer data points for the last 500 years and, therefore, produces a broader age range of 1805–1954 with a median age of 1861 AD and probability p=0.842 for the LAZ23.5–24 sample compared to the INTCAL09 data set; hence, we consider INTCAL09 is better able to determine the most likely age range of this sample, but have retained both for completeness. The 1951–1954 age range for the LAZ23.5–24 sample is not considered likely in the INTCAL09 data set. Data in boldface are considered “most likely”; calibrated age ranges not in stratigraphic order (and therefore on the “incorrect” side of the “bomb” C-14 peak), and pMC calibration data with probabilities less than 0.1 have been omitted for clarity; where shown, the figure in brackets is the probability excluding calibrated ages which are out of stratigraphic order; combined errors on growth rates are typically 5–10%; + indicates date of sample collection, not date of measurement. Age model A contains the "most probable" age; B is a maximum age model; C is a minimum age model.
Table 4 Pb-210 and Cs-137 count and dating data. Samples were extracted from 2 cm depth intervals, dried at 80°C and ground/homogenized. Samples were palletized and standard laboratory efficiency calibrations used, derived from NPL RO8–04 Mixed Radionuclide Spike and ISOTRACK RBZ-B44. All absolute efficiency calibrations have been corrected for variations in sample density and thickness. All testing was performed at room temperature and tested against international standard reference materials. Unsupported Pb-210 estimates are derived from the constant rate of supply (CRS) method (Appleby & Oldfield Citation1978).