Figures & data
Fig. 1 Screen capture of the questions page of the online survey. (Photo by Frédérique Olivier.)
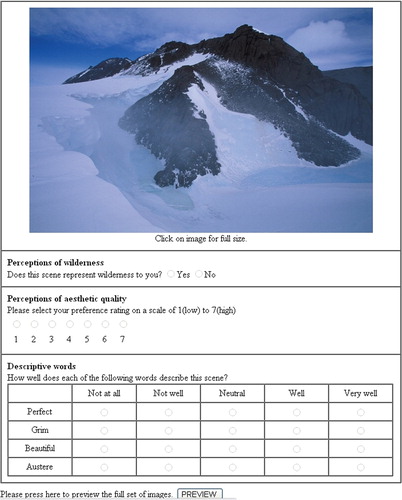
Table 1 Number of scenes in each of the landscape types and the type of human activity in each. There is some overlap between images showing infrastructure and transient activity, for example, a photograph of vehicles parked near a field hut.
Fig. 2 (a) Original Environmental Domains of Antarctica and (b) the reclassified landscape types used in the analyses.
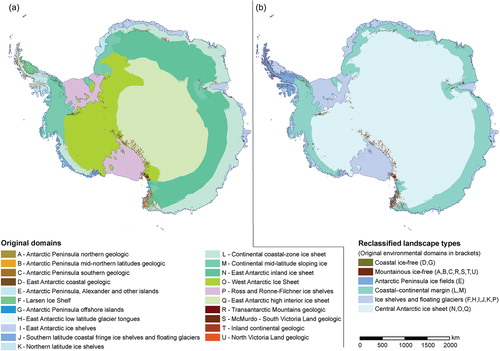
Fig. 3 Examples of original and digitally modified images. (a) Original image of a coastal ice-free scene (photo by Rupert Summerson) and (b) the modified image. (c) Original image of a mountainous ice-free scene (photo used with permission of the Australian Antarctic Division) and (d) the modified image. (e) Original image of an ice shelf (photo by John Penney, National Science Foundation Photo Library) and (f) the modified image. (g) Original image of an Antarctic Peninsula ice field (photo by Rupert Summerson) and (h) the modified image. (i) Original image of the central Antarctic ice sheet (photo by Brian Vasel, National Oceanic and Atmospheric Administration) and (j) the modified image.
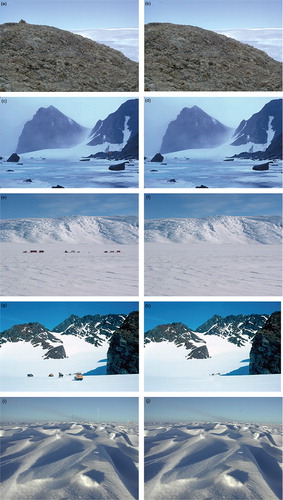
Table 2 Number of survey participants from different nations and regions.
Table 3 Maximum number of respondents in each set of images.
Fig. 4 Ranges of assessments of “wilderness” among images with human content, grouped by human content type. “Complex infrastructure” is defined as multiple buildings and structures, for example, stations. “Minor infrastructure” is one or two buildings and/or structures, for example, field huts. “Major transient” is defined as ships, aircraft or heavy vehicles. “Minor transient” is light vehicles or people on foot. “Tracks only” are tracks in snow only. The figures in brackets are the numbers of images in each group. The vertical bars represent the range of assessments in each group: minimum to maximum; the mean is represented by the cross-bar. The range of assessments of “wilderness” of the 45 images without human content is shown on the right for comparison.
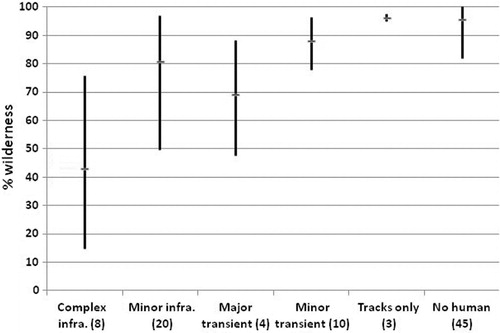
Fig. 5 Percentage assessments of wilderness: all images with and without human presence aggregated by landscape type. The black columns are the percentages of responses perceived as wilderness of all images with human presence. The grey columns are the percentages of assessments of wilderness of all images in each landscape type without human presence. Landscape types are abbreviated as follows: coastal ice-free (CIF), mountainous ice-free (MIF), coastal–continental margin (CCM), peninsula ice fields (PIF), ice shelves (IS) and central Antarctic ice sheet (CIS).
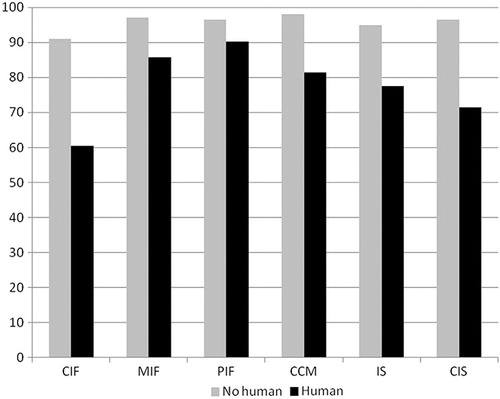
Table 4 Results of Pearson's chi-square tests with Yates's continuity correction (χ2) comparing assessments of wilderness and not-wilderness between all images aggregated by landscape type, differentiated by all images, images containing infrastructure and images containing transient activity. Significance (p) and effect size (Φ) are shown.
Fig. 6 Percentages of assessments of wilderness for each image pair in the 16 pairs of images. Landscape types are abbreviated as follows: coastal ice-free (CIF), mountainous ice-free (MIF), coastal–continental margin (CCM), peninsula ice fields (PIF), ice shelves (IS) and central Antarctic ice sheet (CIS). The type of human presence in the original images is either infrastructure (I) or transient activity (T). The black column represents values for images with human presence, and the grey column to images without human presence. Significant difference is indicated with asterisks.
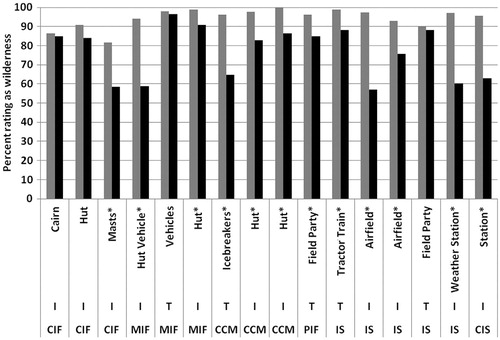
Table 5 Results of chi-square tests of responses on perceptions of wilderness of the 17 pairs of digitally manipulated pairs of images. Italicized significance (p) values are results from Fisher's Exact Test, used in place of χ2 owing to frequencies <5 in cells in contingency tables.
Fig. 7 Frequency plot of Z scores and raw aesthetic preference ratings for all images in the survey.
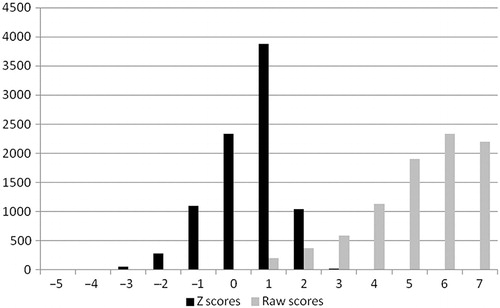
Fig. 8 Mean aesthetic (Z) scores of images, with human content, transient activity and infrastructure, aggregated by landscape type. Landscape types are abbreviated as follows: coastal ice-free (CIF), mountainous ice-free (MIF), coastal–continental margin (CCM), peninsula ice fields (PIF), ice shelves (IS) and central Antarctic ice sheet (CIS).
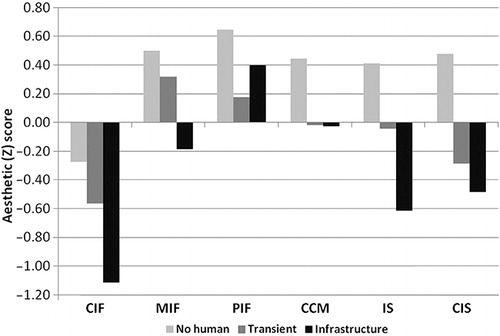
Table 6 Aesthetic (Z) scores for landscape types, with t-test results comparing images with no human content and images with transient human activity.
Table 7 Aesthetic (Z) scores for landscape types, with t-test results comparing images containing no human content and images with infrastructure.
Table 8 Mean differences between the aesthetic (Z) scores of images with human presence and “natural” (manipulated) images.
Fig. 9 Examples of the types of infrastructure and transient activity and significance in differences in wilderness scores in the manipulated pairs. Only the non-manipulated images are shown. (Photos: Australian Antarctic Division, Ewan McIvor, Rupert Summerson and—courtesy of the US National Science Foundation Antarctic Photo Library—Kristan Hutchison, John Penney and Jordan Dickens.)
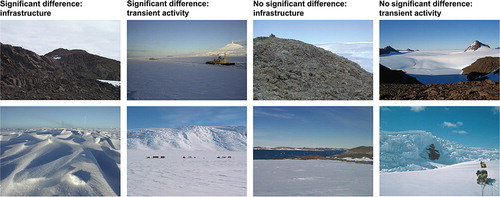
Fig. 10 Aesthetic Z scores for all images without human content, averaged by landscape type. The horizontal bars represent 95% confidence intervals. Landscape types are abbreviated as follows: coastal ice-free (CIF), mountainous ice-free (MIF), coastal–continental margin (CCM), peninsula ice fields (PIF), ice shelves (IS) and central Antarctic ice sheet (CIS).
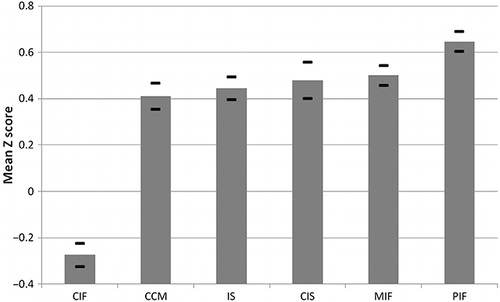
Fig. 11 (a–c) The three most aesthetically preferred and (d–f) the three least aesthetically preferred natural scenes, that is, without human presence. (Photos: [a] Paul Thur; [b] Zee Evans; [c] Frédérique Olivier; [d] Rupert Summerson; [e] and [f] Ewan McIvor. Photos [a], [b] and [f] courtesy of the US National Science Foundation Antarctic Photo Library.)
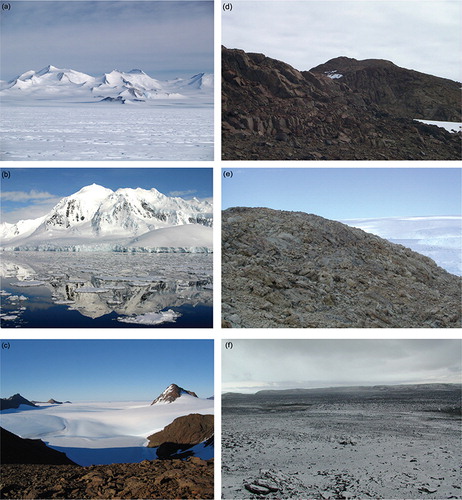
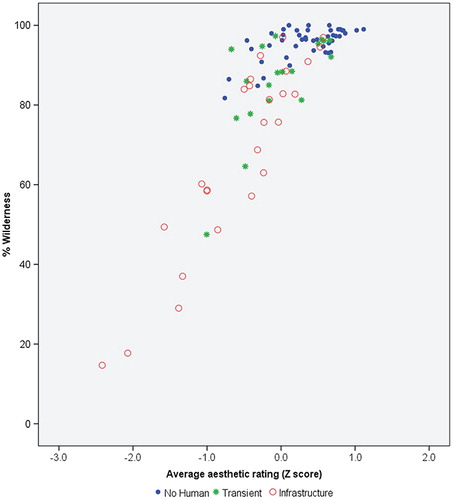
Fig. 12 Scatter plot of averaged responses to wilderness and aesthetic value of all 90 images. Perception of wilderness is expressed as a percentage of responses as wilderness to each image and aesthetic values as mean Z scores.