Figures & data
Fig. 1 The study area in Allen Bay, Cornwallis Island, Nunavut, with an inset showing the Canadian Arctic Archipelago. The zigzagging lines illustrate the hydroacoustic transects undertaken on 29 and 31 August 2010. Circles show the locations of shore-based observations.
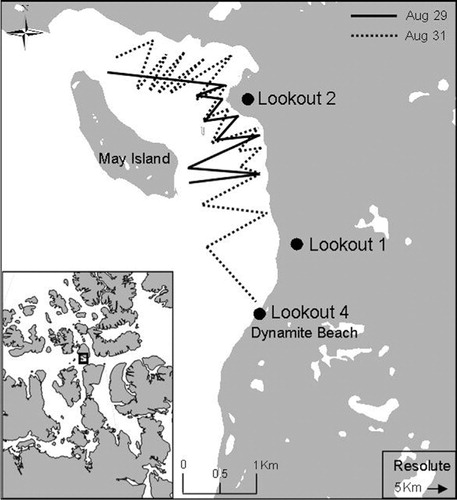
Table 1 The Akaike information criterion with small-sample bias adjustment (AICc) optimal linear model selection for environmental variables influencing the presence of schools of Arctic cod (Boreogadus saida) during shore-based observations (N=15). The best eight models are presented based on the smallest AICc differences. Statistically significant variables are indicated with asterisks.
Fig. 2 Representation of visible schools (A–F) observed from elevated positions during shore-based observations. Inset: Letters correspond to a school which is shown in its approximate size and shape. Size was estimated based on surface area and standardized using a qualitative scaling grade of 0–5 (0≤30 m2<1≤200 m2<2≤1000 m2<3≤6000 m2<4≤10 000 m2<5).
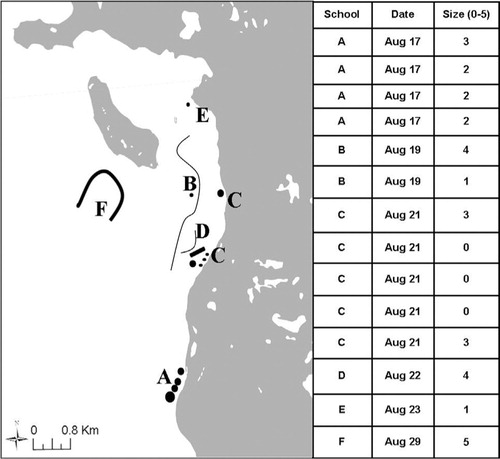
Fig. 3 Location and shape and size and duration (inset) of schools (G–N) and number of birds observed during large feeding events (>100 birds). Note schools G and H consisted of larval Arctic cod (Boreogadus saida) and size was not estimated. Schools G and H were observed from our boat before surveys commenced. The size of schools was not correlated with the number of birds. Species names are abbreviated as follows: glaucous gull (Larus hyperboreus) is GLGU, northern fulmar (Fulmarus glacialis) is NOFU and black-legged kittiwake (Rissa tridactyla) is BLKI.
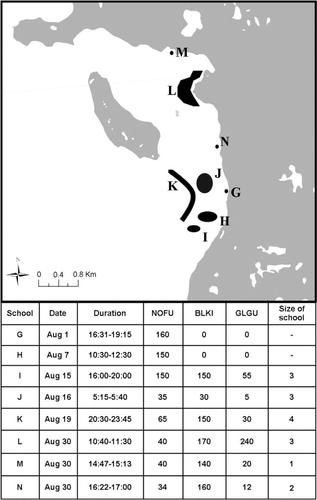
Fig. 4 Demersal school (black arrow) and nearby shallow “satellite” schools (white arrows). The dashed area represents the blanking range of about 1.75 m. Note this echogram was recorded independent of bird survey on 29 August 2010.
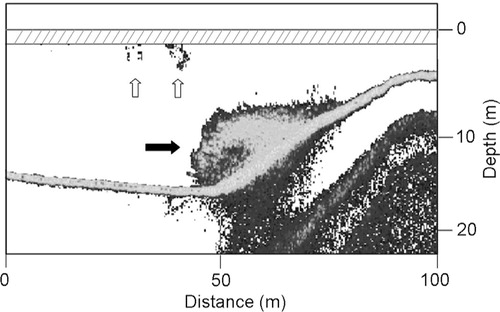
Table 2 Summary of results of hydroacoustic surveying during 29 and 31 August 2010. Fish per unit area (areal density) is abbreviated to FPUA, fish per unit area (volume density) to FPCM and target strength to TS (decibels).
Fig. 5 (a) The density (birds km-2) of black-legged kittiwakes (Rissa tridactyla), northern fulmars (Fulmarus glacialis) and glaucous gulls (Larus hyperboreus) during the survey on 31 August 2010. (b) Schools detected in Allen Bay during the same survey. Solid bars represent length of school.
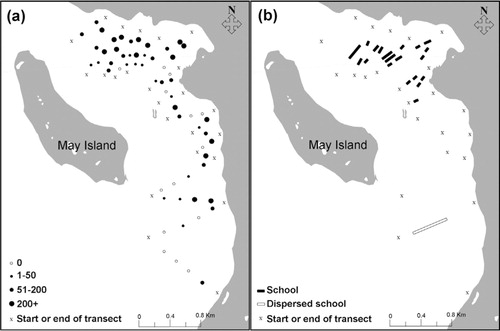
Fig. 6 Density of seabirds counted in each 250 m long section (N=87) on 29 August 2010 and 31 August 2010 partitioned when schools were present and absent. Species names are abbreviated as follows: glaucous gull (Larus hyperboreus) is GLGU, northern fulmar (Fulmarus glacialis) is NOFU and black-legged kittiwake (Rissa tridactyla) is BLKI. Significant differences (P<0.05) are indicated with asterisks.
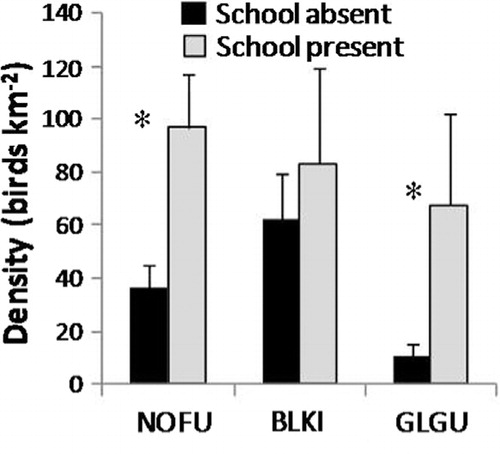
Fig. 7 (a) Arctic cod per unit area (FPUA; fish m-2), (b) transect abundance (TA) and (c) minimum depth of Arctic cod (Boreogadus saida) schools (N=35) when below-average (absent) and above-average (present) densities of each seabird species occurred. Average densities were as follows: glaucous gull (GLGU; Larus hyperboreus) 34.08 birds km-2; northern fulmar (NOFU; Fulmarus glacialis) 61.61 birds km-2; and black-legged kittiwake (BLKI; Rissa tridactyla) 71.12 birds km-2. All comparisons are at the 95% confidence level.
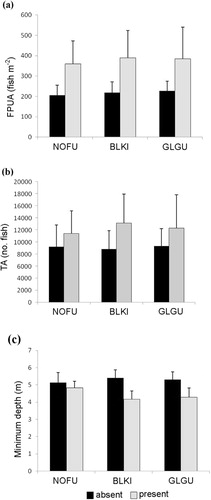
Table 3 Association between seabird densities in each 250 m long section (N=87) surveyed on 29 and 31 August 2010 partitioned when schools were present and absent. Species names are abbreviated as follows: glaucous gull (Larus hyperboreus) is GLGU, northern fulmar (Fulmarus glacialis) is NOFU and black-legged kittiwake (Rissa tridactyla) is BLKI. R2 is Spearman rank correlation and Phi is Phi coefficient of association. Significant differences (P<0.05) are indicated with asterisks.