Figures & data
Fig. 1 The weather in Ny-Ålesund during winter 2010. Bars represent daily total precipitation (measured between 6:00 h day t − 1 and 6:00 h day t), solid line indicates fluctuations in daily average temperature (00:00–24:00 h day t). Arrows indicate when major precipitation events (i.e., >10 mm daily precipitation measured in day t) occurred at above-zero temperatures (measured in day t − 1). These occurred on 11–12 November (total 43 mm), 11 December (17 mm), and 17–19 January (total 55 mm). Source: the Norwegian Meteorological Institute.
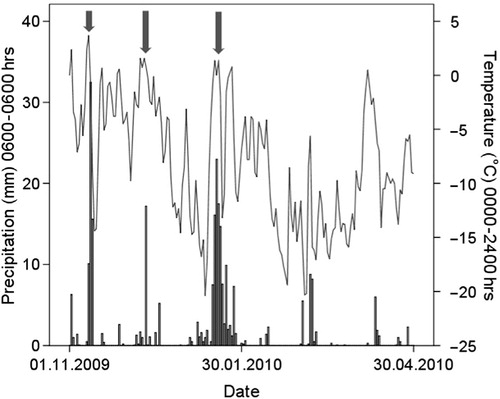
Fig. 2 (a) Ridge habitat coated with ground-ice on the coastal plain of Sarsøyra during April 2010. (b) Reindeer feeding on kelp on the beaches of Sarsøyra, with blocks of sea-ice in the background. (c) Reindeer feeding craters with kelp fragments at Sarsøyra. Photographer: B.B. Hansen (Norwegian Polar Institute).
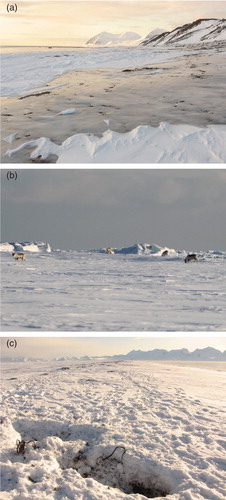
Table 1 Distribution of kelp-feeders versus non-kelp feeders across populations and demographic groups in a Svalbard reindeer meta-population during a “snap-shot” (population survey) in late winter 2010. Total estimated population size was 206 animals.