Figures & data
Fig. 1 Glacier topography (50 m contour interval) and drainage basins of Austfonna derived from the DInSAR/ICESat digital elevation model. An orthorectified version of a synthetic aperture radar intensity image from 5 March 1996 is also shown. The inset map shows the location of Austfonna (79.8°N, 24°E) in Svalbard. Glacier basins that are known to have surged are indicated with an S.
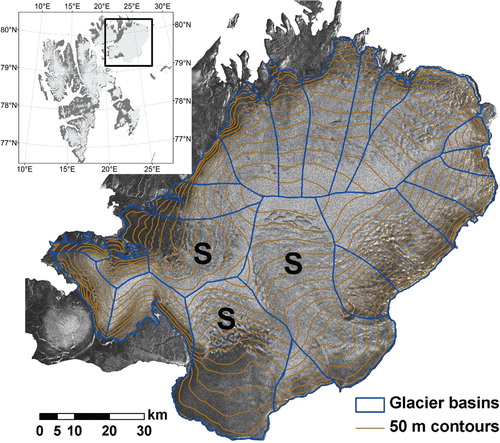
Fig. 2 Two-pass interferograms (Int) and smoothed combined interferograms (dInt): (a) Int A from 5–6 March 1996 with dominating topographic fringes (B ⊥ ca. 178 m), (b) Int B from 9–10 April 1996 with some visible movement fringes (B ⊥ ca. 34 m), (c) dInt A-B with topography only (B ⊥ ca. 212 m), and (d) dInt A + 5B with most topography removed (B ⊥ ca. 8 m) and upscaled movement fringes remaining.
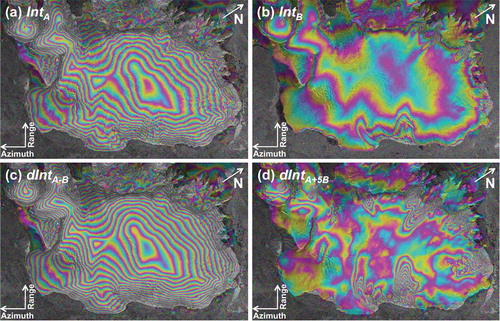
Fig. 3 Validation of the digital elevation model (DEM) with respect to ICESat ground control points from winter 2006–08 (profiles with no outlines), Global Navigation Satellite Systems surface profiles and airborne light detection and ranging (LIDAR) (black outlines). The vertical root mean square error of the DEM was 9–11 m with respect to each of the three reference data sets (). The underlying images are a SPOT-5 scene from 14 August 2008 and a Landsat-7 scene from 10 July 2001 which were used to digitize new glacier outlines.
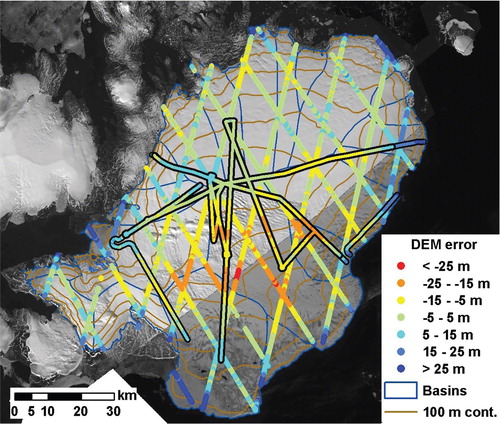
Table 1 The three interferograms that were generated and their associated pairs of ERS-1/2 tandem synthetic aperture radar scenes with satellite track number, acquisition dates and baseline lengths of the parallel (B || ) and perpendicular (B ⊥ ) components at the interferogram centre point. The third interferogram (dInt A-B ) is a differential interferogram between the two first ones (Int A –Int B ).
Fig. 4 Elevation differences between the digital elevation model (DEM) and the three validation data sets: ICESat ground control points (GCPs), airborne light detection and ranging (LIDAR) and surface Global Navigation Satellite Systems (GNSS) profiles. The root mean square error of the DEM with respect to the three data sets is 11 m, 10 m and 9 m, respectively. The spatial distribution of the data can be seen in .
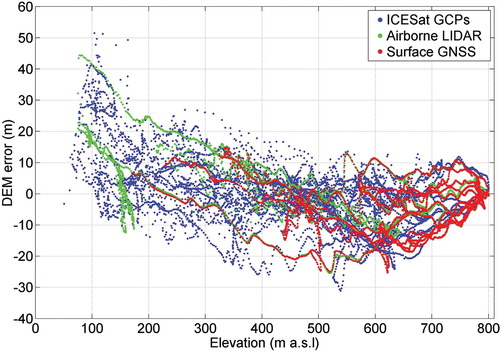
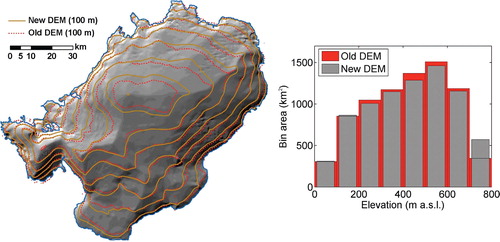
Fig. 5 A comparison of contour lines for the new and old digital elevation models (DEM) of Austfonna. The old DEM is a smoothed merge (K. Melvold, pers. comm.) of the radio-echo-sounding-tied InSAR DEM (Unwin & Wingham Citation1997) and photogrammetric data from the Norwegian Polar Institute (Citation2011). The corresponding glacier hypsometries for 100 m elevation bins are shown to the right. The contour lines are underlain by a hillshade model of the new DEM, showing the major drainage divides of the ice cap.