Figures & data
Table 1 Image sources and camera set-up for the various locations. All camera boxes were equipped with camera, control unit, battery and solar panel. (The use of brand names in this paper is for identification purposes only and does not imply endorsement by the authors.)
Fig. 1 (a) Svalbard, location of the study areas: (1) Kronebreen, (2) Comfortlessbreen and (3) Nathorstbreen. Camera set-up positions indicated with white spots; (b) Kronebreen, right (R) and left (L) camera, white dotted line indicate location of measured targets; (c) Comfortlessbreen, cameras A and B; (d) Nathorstbreen, size of frame inset corresponds to . Background images (b–d) are from the Système Probatoire pour l'Observation de la Terre (SPOT) Stereoscopic Survey of Polar Ice: Reference Images and Topographies (SPIRIT) programme, © Centre National d'Etudes, France (2007) and SPOT Image 2007 all rights reserved.
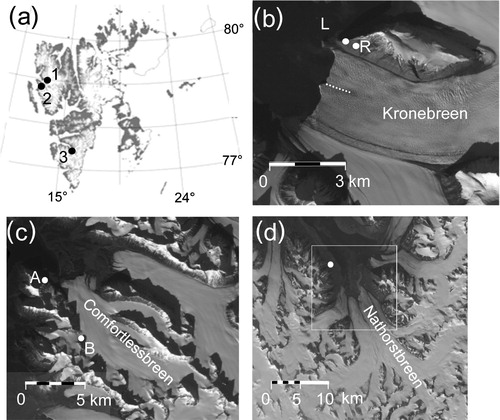
Fig. 2 Image frames at the various locations: (a) left camera at Kronebreen; (b) right camera at Kronebreen; (c) Comfortlessbreen camera B and (d) Nathorstbreen.
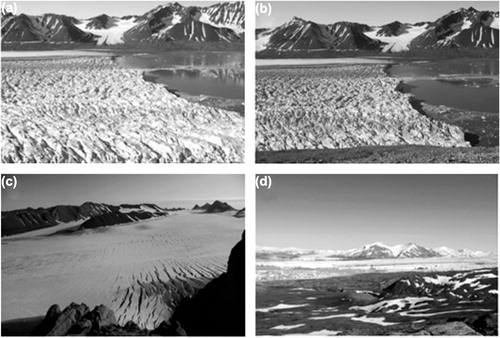
Fig. 3 Theoretical height accuracy of stereo measurements as a function of the base/distance (B/D) ratio. The relation is (D2·σpx/ B·f) where B is the base between cameras, D is the distance (height in vertical photography), f (focal length) is 28 mm and σpx (measurement accuracy of parallax) is 10 µm. The theoretical height accuracy corresponds to distance accuracy in a terrestrial image with a horizontal photographic axis.
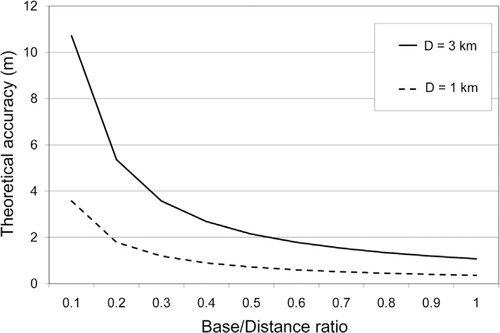
Fig. 4 Image measurements and object displacement varying with the direction of photography and direction of flow. The numbers 1 and 2 represents measurements of the same object in two different images in a time-lapse series.
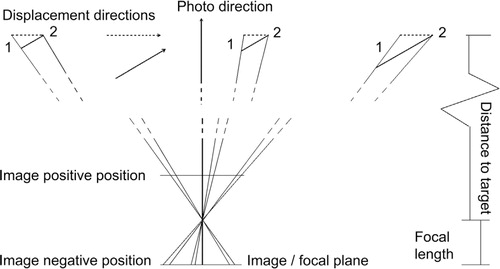
Fig. 5 Scale factors resulting from different angles between direction of photography and direction of flow for a 23 mm lens on a 24×16 mm charge coupled device. The figure corresponds to an image in positive position with flow from left to right, as illustrated in . The 74°(N) curve is for Nathorstbreen.
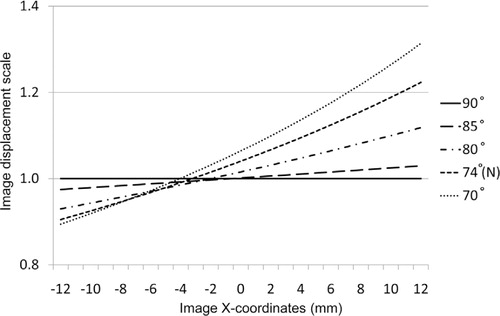
Table 2 Accumulated displacements from stereoscopic (S) and single-image time-lapse measurements (TL) of Kronebreen for various periods. For stereoscopic results also the direction deviation in degrees (SD dev.°) to seasonal average is listed.
Fig. 6 Daily mean velocities (nine targets) from left and right camera on Kronebreen. Average from both cameras and absolute difference. Error bars on daily means indicate standard deviation of daily average of the nine targets measured.
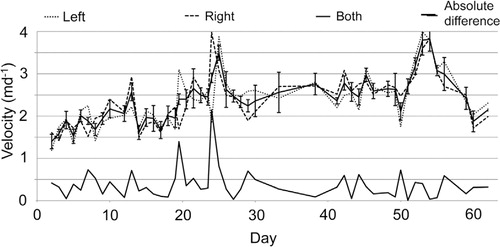
Fig. 7 Relative horizontal and vertical average rotations in left and right camera at Kronebreen, derived from measurements of distant control points.
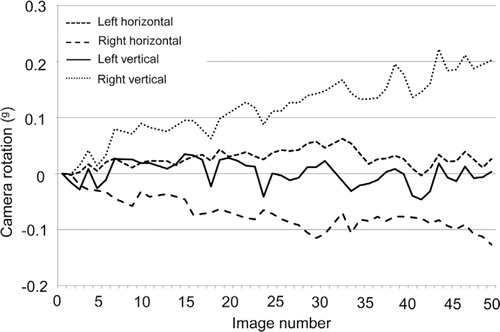
Fig. 8 Comfortlessbreen: (a) Mean velocities derived from crevasse tracking in aerial and QuickBird images in frontal, lower and middle part of the glacier; (b) Cross-profile velocities from camera B (grey) compared with aerial photograph–QuickBird results.
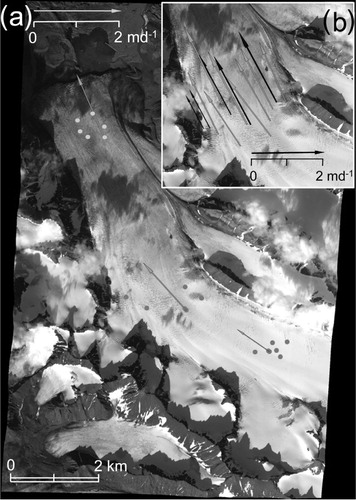
Fig. 9 (a) Comfortlessbreen, frame from camera A and the resulting orthophotograph: (b). (c) Nathorstbreen frame from airliner in September and (d) the resulting orthophotograph. A1, 2–E1, 2 indicate target pairs in transversal profile, while R–U are targets in the longitudinal profile.
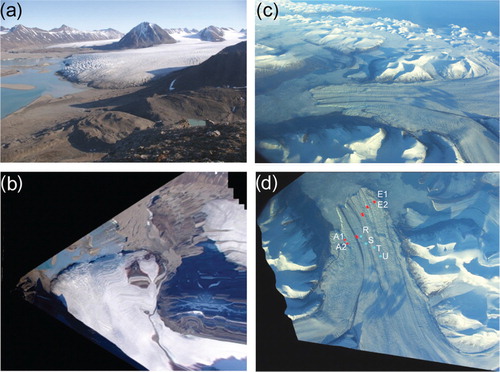
Fig. 10 Nathorstbreen: cross-profile velocities derived from time-lapse camera. Three-day average velocities for neighbouring target pairs A1, 2–E1, 2. See d for location of the targets.
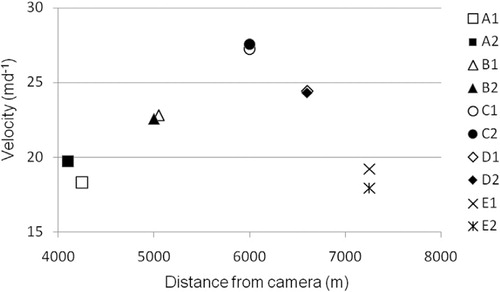
Fig. 11 Nathorstbreen: longitudinal profile velocities derived from time-lapse camera. Day-to-day velocities for targets R–U. See d for location of the targets.
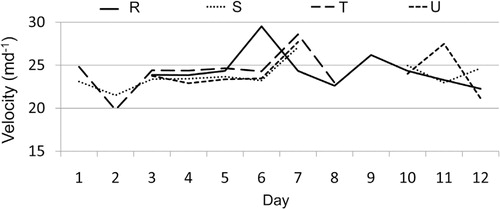
Fig. 12 Nathorstbreen: front positions compiled from orthophotographs from airliners in 2009. The background image is from SPOT 5, 1 September 2008.
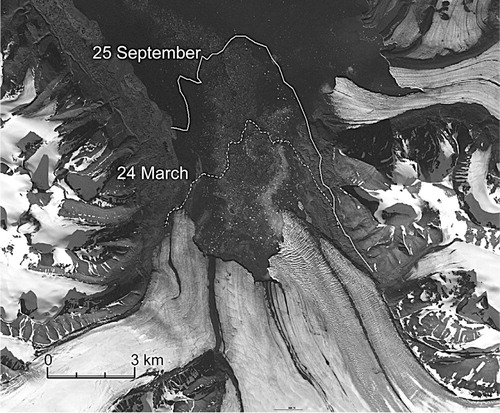
Table 3 Displacement of measured target groups in the middle, lower and frontal part of Comfortlessbreen (see , for location of the targets) derived from crevasse tracking in orthophotographs derived from aerial photographs and QuickBird imagery. Avg is average and SD is standard deviation of displacement.