Figures & data
Fig. 1 Location of Ariebreen in the Hornsund region on the island of Spitsbergen, Svalbard. The orthophotograph in (a) corresponds to 1990 (Jania et al. Citation2002; Kolondra Citation2002), while the glacier extent depicted in (b) corresponds to 2007. In (b) the layout of the 200-MHz radar profiles done in August 2006 (orange lines), and the 25-MHz profiles done in April 2007 (blue lines) and April 2009 (black line) are shown. The radar sections corresponding to profiles A–B and C–D are shown in . The equilibrium line (EL) at the end of the balance years 2007–08 and 2008–09 is also shown. The corresponding accumulation area ratios were 0.25 and 0.20.
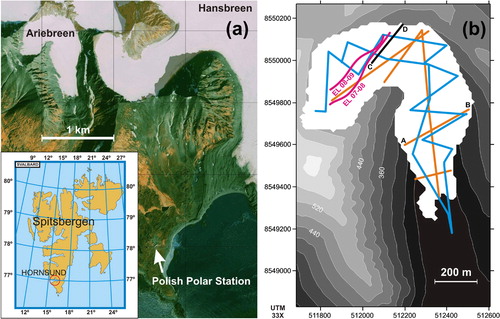
Fig. 2 Surface topography of Ariebreen in (a) 1936, (b) 1990 and (c) 2007. Contour line interval is 40 m. The estimated errors in surface elevation are 13.60, 3.00 and 1.03 m, respectively.
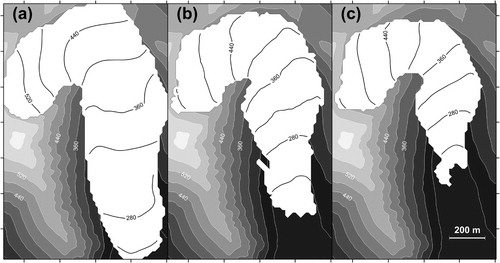
Fig. 3 (a) Map of ice thickness, H, of Ariebreen in 2006/07, determined from the radar profiles shown in . Contour line interval is 10 m. The estimated glacier-averaged error in ice thickness is 3.29 m. (b) Bedrock topography of Ariebreen, determined by subtracting the ice thickness shown in from the surface topography shown in c. Contour line interval is 40 m. The estimated error in bedrock elevation is 3.44 m. (c) Map of surface elevation changes, ▵Z, of Ariebreen during the period 1936–2007. Negative values mean thinning. Contour line interval is 10 m. The estimated error is 13.64 m.
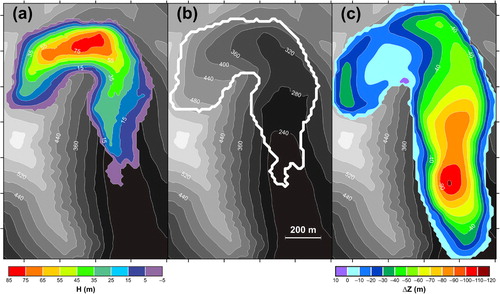
Fig. 4 Spatial distribution of the elevation change rate, ▵Z/▵t, of Ariebreen for the periods (a) 1936–1990 and (b) 1990–2007, respectively. Contour line interval is 0.25 m y−1. (c) Spatial distribution of the elevation change acceleration, ▵ 2 Z/▵t 2, between both periods, computed as the increment of elevation change rate divided by the time between the centres of each period. The estimated errors are 0.26, 0.19 m y−1 and 0.009 m y−2, respectively. The quantities are not converted to water equivalent.
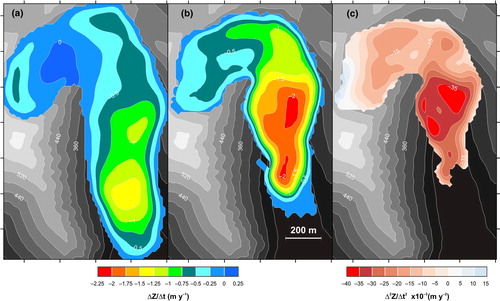
Table 1 Glacier area and volume of Ariebreen in 1936, 1990 and 2007, and their percent changes for the different periods.
Table 2 Mean mass balance rate equivalent to the volume changes of Ariebreen estimated from surface elevation changes over different periods.
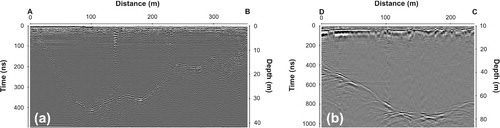
Fig. 5 Examples of radar sections: (a) 200-MHz radar, corresponding to a transverse profile on the lower glacier (profile A–B in ); (b) 25-MHz radar, corresponding to a transverse profile on the upper glacier (profile C–D in ). Both are free from the internal diffractions and scattering typical of temperate ice.