Figures & data
Fig. 1 (a) Map of the major volcanic zones of Iceland (based on Johannesson & Saemundsson 1998). D, H and E refer to major trough names. (b) Location of surface and/or down-core sediment sample sites around Iceland. See Supplementary Table S1 for details.
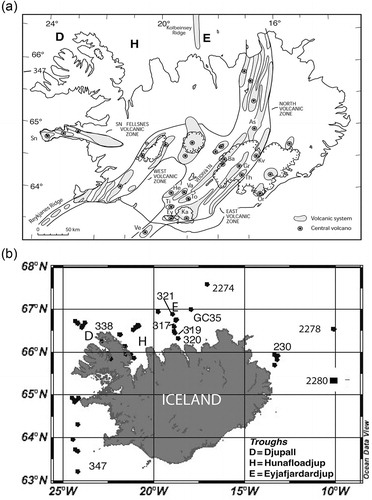
Fig. 2 (a) X-ray diffraction standard patterns from RockJock v6 showing the characteristic hump in amorphous materials between 15° and 30° 2-theta. Shown are the patterns for Hekla-4 volcanic glass, obsidian, White River volcanic glass, diatoms and Saksunarvatn volcanic glass. These plots have individual mineral peaks eliminated with the Peak-Chopper software program (Eberl Citation2003). (b) X-ray diffraction patterns for samples of Hekla-4 tephra (dark grey), Saksunarvatn tephra (light grey) and diatoms (black) prepared with the addition of ZnO (10% by wt). Note that for this plot the individual mineral peaks have not been eliminated by using PeakChopper. The difference in counts (y axis) compared to a is associated with the different preparation of standards vs. samples (Eberl Citation2003).
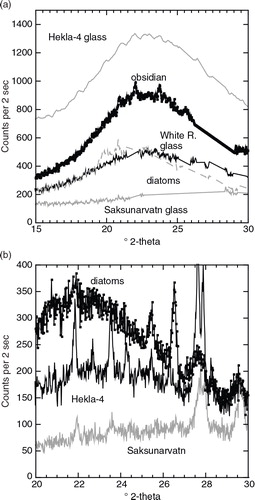
Fig. 3 Comparison of measured and calculated (RockJock v11) wt% of White River glass and tephra (x axis) to a ground-up granite. The dotted line shows the ideal curve that passes through the origin.
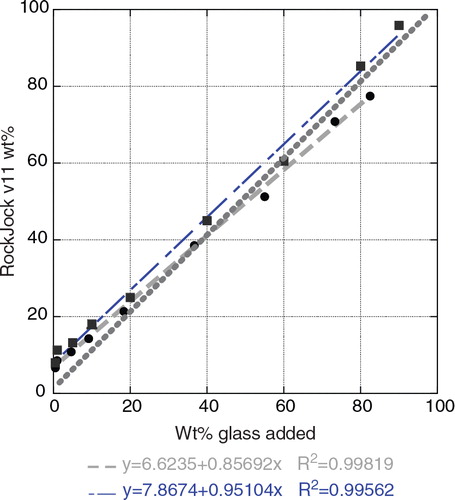
Fig. 4 (a) Scatter plot of total glass x-ray diffraction (qXRD) wt% using the White River glass standard and RockJock v5 (see in Andrews et al. Citation2006) vs. the combined wt% of Hekla-4 glass and Saksunarvatn glass from B997-321PC using RockJock v6. (b) Comparison of the total counts of tephra shards >150 µm in B997-321PC with wt% estimates of total glass from qXRD analyses (RockJock v6).
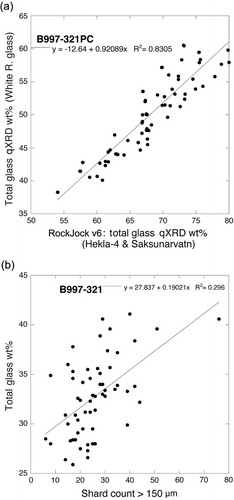
Fig. 5 (a) Wt% of total volcanic glass in surface samples. (b) Median wt% of volcanic glass in the cores (). Note that in these plots some of the individual sites are not visible because of the spatial overlap.
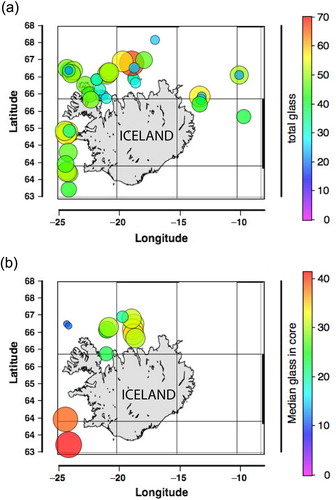
Table 1 Geochemical data for cores B997-317PC1, -3129PC2 and -338PC (see Kristjánsdóttir Citation1999 and Supplemental Table S3). Figures in parentheses after average is the number of analyses.
Fig. 6 Plots vs. depth of residuals from percentages of tephra shards >150 µm in core B997-317PC1: (a) fresh light (rhyolitic) and (b) fresh dark (basaltic; see b) vs. residuals (c) from the wt% total glass content from the <2 mm sediment; and (d) residuals from lithic counts (which include reworked tephra). Calibrated radiocarbon dates are shown including one “modern”. The line at ca.160 cm represents an apparent unconformity as the tephra at 162 cm has a Vedde-like composition and calibrated date of 11 050±250 Ky B.P. X represents levels where geochemical analyses have been undertaken (see ) on individual handpicked tephra shards.
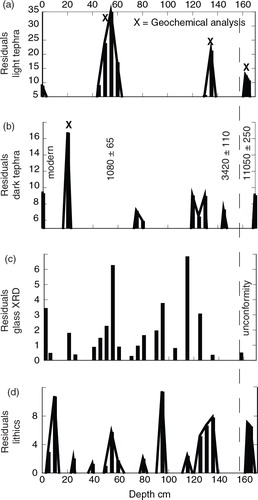
Fig. 7 Plots vs. depth of residuals from percentages shards >150 µm in core B997-319PC2 (b) of (a) light and (b) dark tephra vs. residuals (c) from the wt% total glass content from the <2 mm sediment; and (d) residuals from lithic counts. Calibrated radiocarbon dates are shown (). X represents levels where geochemical analyses have been undertaken (see ) on individual handpicked tephra shards.
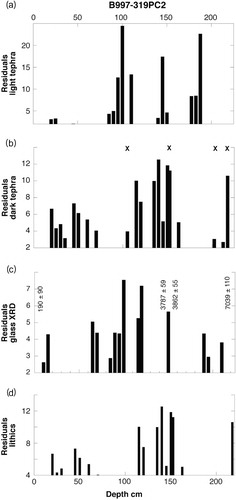
Fig. 8 Down-core plot of data from B997-338, off north-west Iceland (b) showing residual glass peaks, levels for geochemical analyses (X), calibrated radiocarbon dates (∆R=0) and counts of ice-rafted debris (IRD) >2 mm/14 cm2 from x-radiographs. X represents levels where geochemical analyses have been undertaken (see ) on individual handpicked tephra shards.
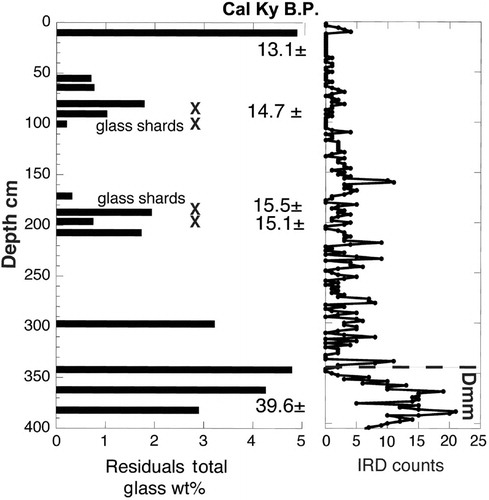
Table 2 Comparison of the “old” dates (left column) on B997-338PC vs. the new dates on articulated bivalves. The calibrated ages assume a ▵R of zero; see text for discussion. Dates were calibrated in Calib 5 software program. Asterisks indicate suspect dates.
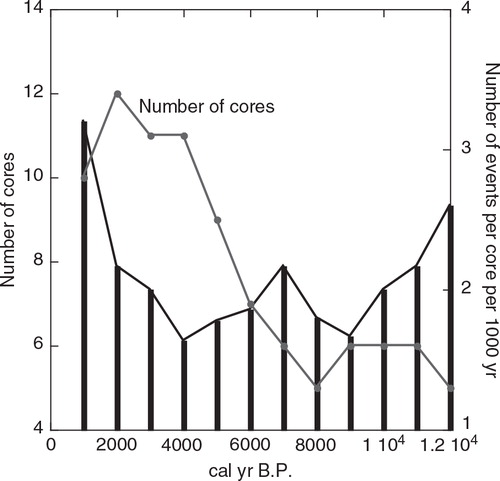
Fig. 9 Plots of number of probable tephra events per 1000 yr from counts of the residual glass wt% plots (e.g., , ) and the number of cores for each 1000 yr interval (grey line with filled circles).