Figures & data
Table 1 Chemical and biological characteristics of the sampling sites.
Table 2 Summary of number of obtained 16S rRNA partial gene sequences and number of observed operational taxonomic units (OTUs; sequence similarity ≥ 97%) among cultivated bacterial isolates in freshwater and snow (different sampling depths combined).
Table 3 Summary of pyrosequence (tags) numbers, numbers of operational taxonomic units (OTUs; ≥ 97% sequence similarity) and diversity estimates. To allow comparison of the Shannon-Weaver diversity index between samples, an equal number of sequences (33 882) from each community was randomly selected and used for the analysis. Note that the data represent summed tags for replicate samples within each environment. Chloroplasts were excluded from the analysis.
Fig. 1 Rarefaction curves of operational taxonomic units (OTUs; ≥97% sequence similarity) of the (a) 16S rRNA gene metagenomic community libraries and (b) cultivated bacteria. Note that in (b), OTUs of the three snow depths have been combined.
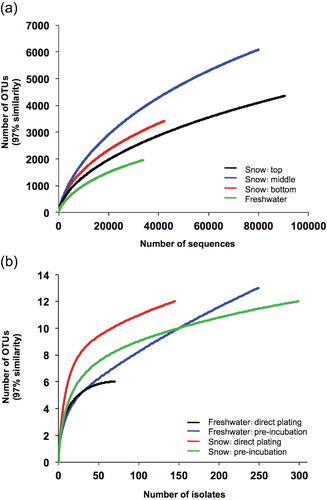
Fig. 2 Dendrograms based on the Bray–Curtis similarity measure showing the relatedness of the microbial communities in snow and freshwater: (a) pyrosequencing; (b) cultivation/pre-incubation on filters; (c) cultivation/direct plating. Also shown is the distribution of the most frequent phylogenetic groups within each community. Note that in (a), the data represents the combined results of several replicate samples within each environment (see Supplementary Fig. 1S for data associated with individual samples).
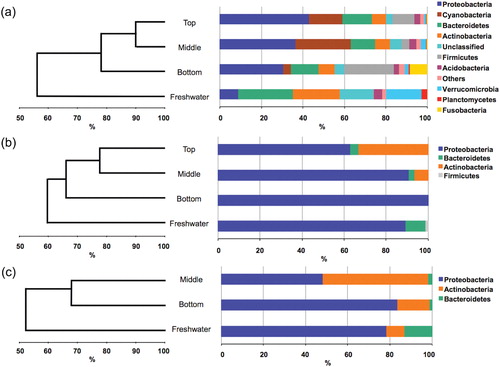
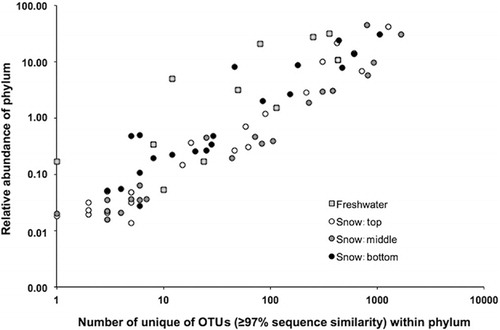
Fig. 3 Relative abundance of phyla as a function of the number of unique operational taxonomic units (OTUs).