Figures & data
Table 1 Tardigrade collections in Alaska, 2009, arranged from north to south latitudes.
Fig. 1 Tardigrade collections: (a) prior collections by Meininger & Spratt (Citation1988; V), Calloway et al. (Citation2011; W), Mathews (Citation1938; X), Schuster & Grigarick (Citation1965; Y) and Dastych (Citation1982; Z), and (b) collections in this study (letters correspond to site codes in ).
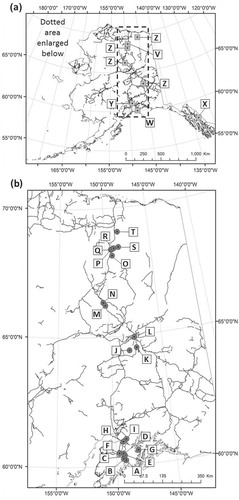
Table 2 Tardigrades of Alaska
Fig. 2 Density of tardigrades from our four clusters of sites. No significant differences were found.
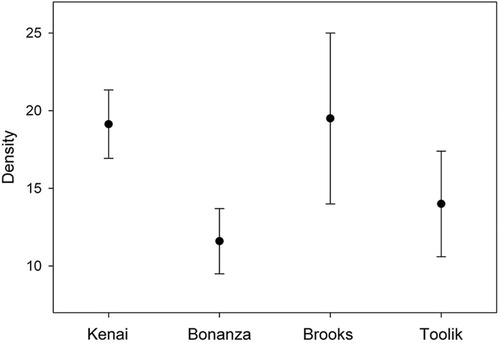
Fig. 3 Tardigrade richness from our four clusters of sites. Only the Bonanza and Kenai sites were significantly different from one another.
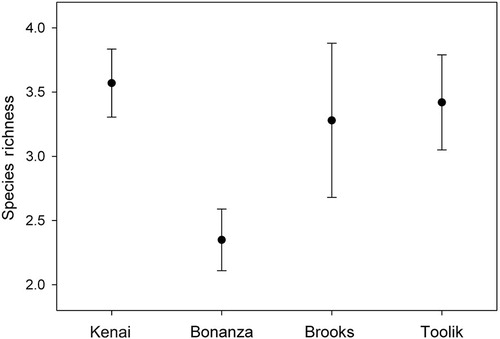
Table 3 Similarity (%) within and among clusters for tardigrade communities across Alaska.