Figures & data
Fig. 1 Maps of Kongsfjorden and Ny-Ålesund.
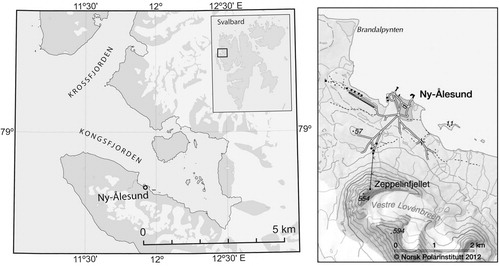
Fig. 2 Bucket sampler for solid precipitation (left) and funnel sampler for liquid precipitation (right).
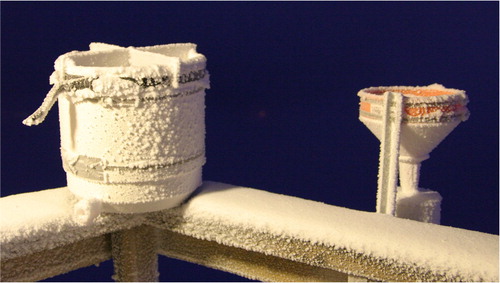
Table 1 Number of precipitation events during sampling campaign, number of reconstructed deposition events (percentage of precipitation events reconstructed) and number of complete and isolated deposition events (percentage of isolated and complete deposition events). A single asterisk marks events and double asterisks mark nss-
and
events.
Fig. 3 Cumulative distribution function of number and mass distributions of -, nss-
- and
-concentration.
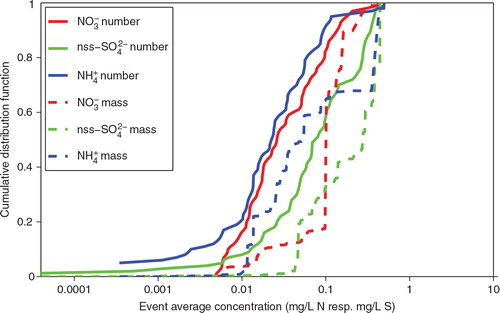
Fig. 4 Cumulative distribution function of number and mass distributions of -, nss-
- and
-deposition.
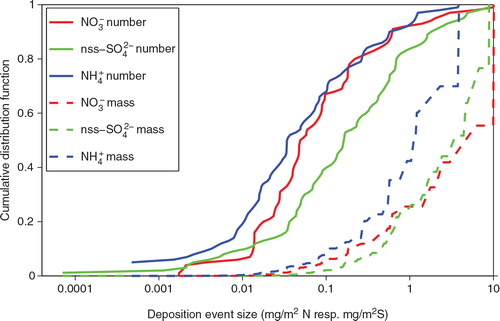
Fig. 5 (a) Precipitation amount. Black bars indicate precipitation events with non-isolated concentration observations. Red bars indicate precipitation events with isolated concentration samples. Event average concentrations of (b) , (c) nss-
and (d)
during the sampling campaign. Red markers indicate isolated and complete events.
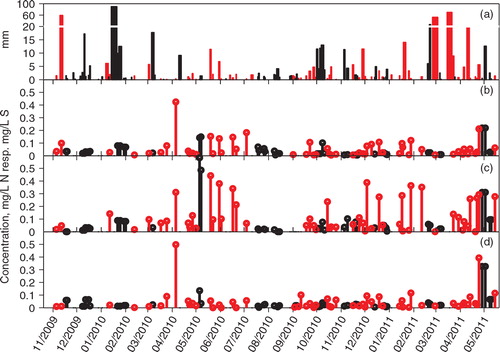
Fig. 6 Deposition events of (a) , (b) nss-
and (c)
during the sampling campaign. Red bars indicate isolated and complete events.
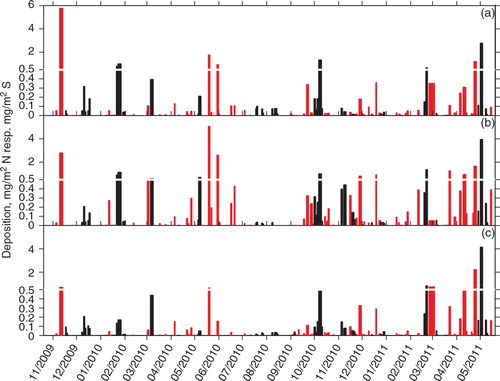
Fig. 7 Scatter plot of precipitation amount versus event average concentrations. Filled markers indicate data from isolated and complete events. Diagonal lines show event deposition of ,
and nss-
in mg m−2 N resp. mg m−2 S.
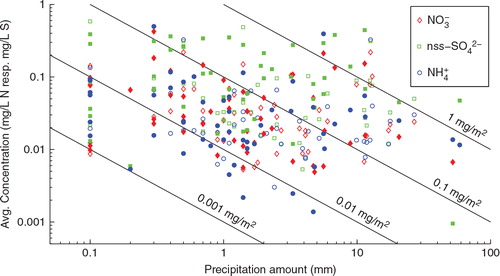
Table 2 Total deposition of scenarios and increase compared to control in percent.