Figures & data
Fig. 1 Sampling stations along the south-to-north transect from continental Norway to Svalbard.
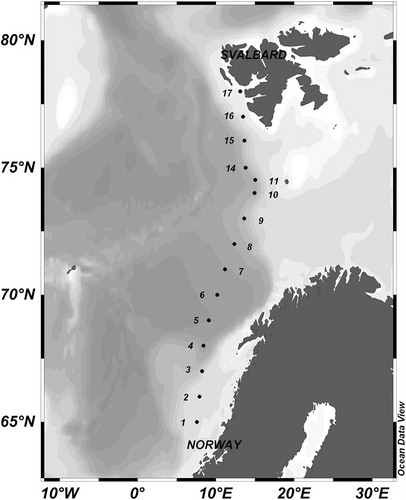
Fig. 2 Surface temperature and salinity data from the numbered stations along the transect.
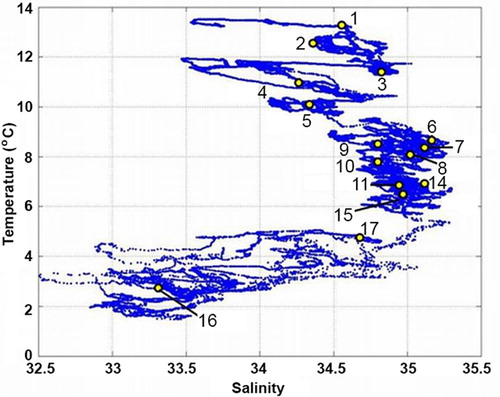
Table 1 List of the taxa with maximum abundance values.
Fig. 3 Microzooplankton abundance data (ind l−1) along the transect.
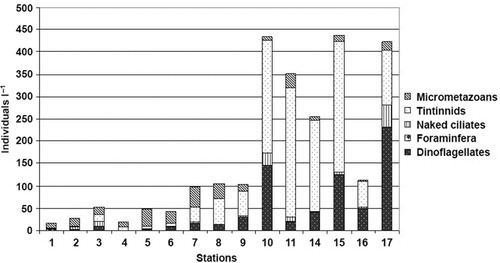
Fig. 4 Number of taxa observed along the transect and temperature values.
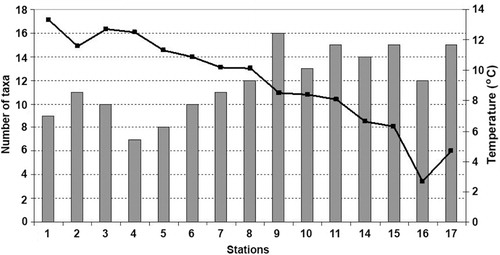
Fig. 5 (a) Acanthostomella norvegica. (b) Parafavella denticulata. (c) Parafavella gigantea. (d) Ptychocylis obtusa. (e) Leprotintinnus pellucidus. (f) Protoperidinium bipes. (g) Dinophysis rotundata. (h) Protoperidinium cf. curtipes. All scale bars are 20 µm in length.
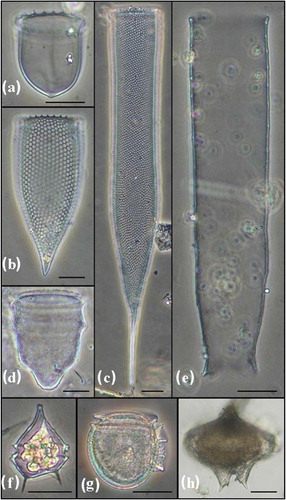
Fig. 6 Microzooplankton carbon content (µg C l−1) along the transect.
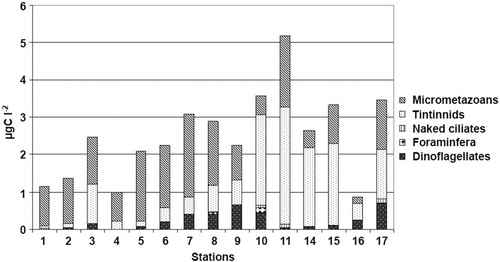
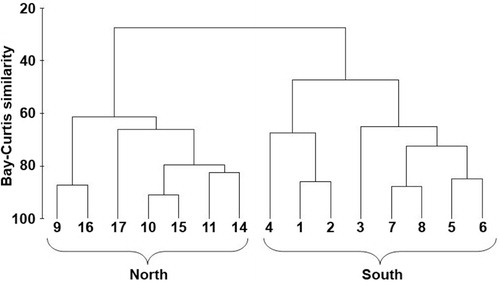
Fig. 7 Cluster analysis on the basis of samplings. The complete linkage was applied.