Figures & data
Fig. 1 Map showing the position of station R1 (+) in Pierre Lejay Bay, Dumont d'Urville Sea, Adélie Land, East Antarctica.
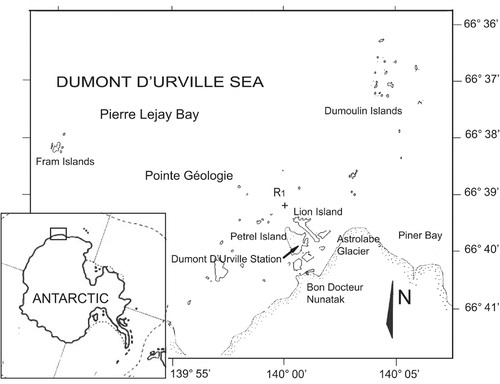
Fig. 2 MétéoSat infra-red satellite images of the sea-ice extent and changes during the ice break-up, Adélie Land, Antarctica from 15 November 2001 to 1 January 2002 (from NOAA12 and NOAA14, via the Service d'Archivage et de Traitement Météorologique des Observations Satellitaires, Lannion, France). The black arrows show station R1 in the Dumont d'Urville Sea and the white arrow in (a) shows the Dibble Glacier tongue. The red lines demarcate the continental limits for the purposes of this study.
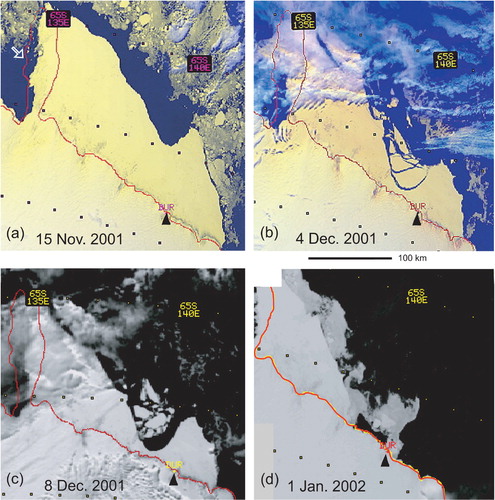
Fig. 3 Temporal variations of (a) air temperature, (b) surface irradiance, (c) wind direction, (d) wind speed, (e) air pressure and (f) tidal height data at the Dumont d'Urville Station from 1 November 2001 to 12 January 2002. Shaded areas indicate the strongest katabatic wind events.
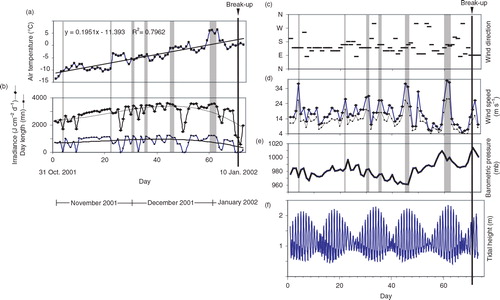
Fig. 4 Sediment traps and current meter mooring line deployed at station R1 from 8 November 2001 to 6 December 2001 in Pierre Lejay Bay.
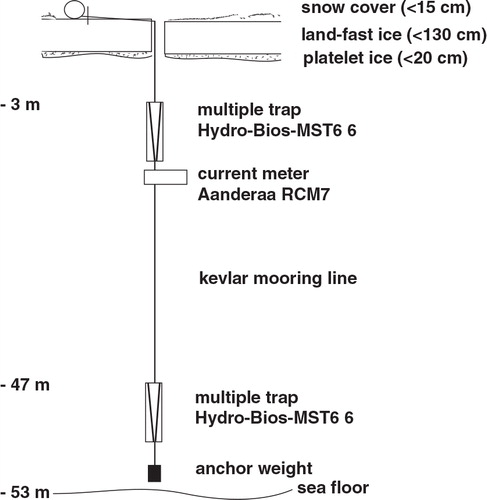
Fig. 5 Temporal variation of (a) ice thickness (y= − 0.2704x+118R 2=0.2655) and snow (y= − 0.1492x+12.011R 2=0.2762), and (b) sub-ice irradiance (µE m−2 s−1) at station R1 in Pierre Lejay Bay from 1 November 2001 (day 1) to 29 December 2001 (day 59). Diamond: ice thickness; square: snow depth.
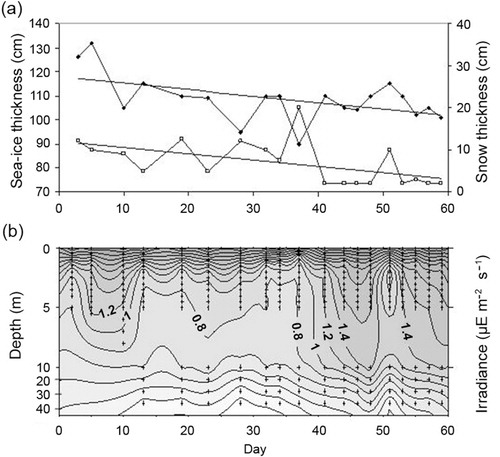
Fig. 6 Relationship between temperature and salinity profiles recorded at station R1 in Pierre Lejay Bay from 3 November to 14 December 2001. Each ellipse represents a daily salinity–temperature profile.
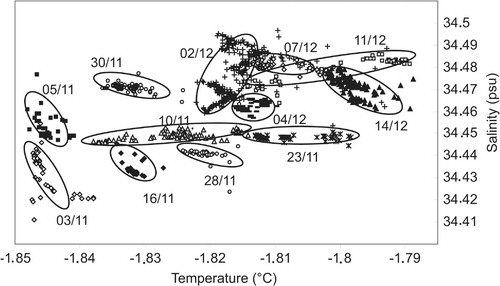
Fig. 7 Progressive vector of currents recorded at 3 m depth under the land-fast ice at station R1 in Pierre Lejay Bay from 1 November (day 1) to 29 December 2001 (day 59). Letters A–E correspond to directional changes of the drift in relation with the tidal amplitude.
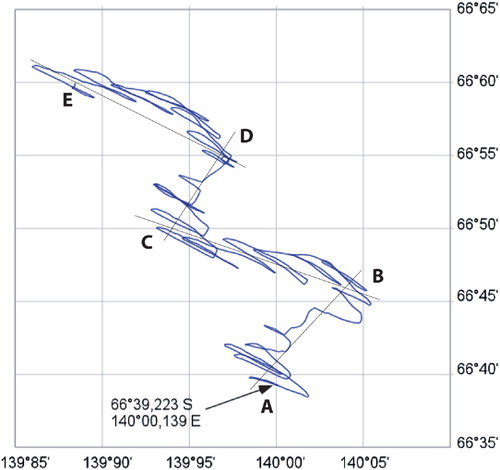
Fig. 8 Temporal variations of (a) salinity, (b) silicic acid (Si[OH4]), (c) nitrite and (d) nitrate plus nitrite
in bottom ice (Bi), platelet ice (Pi) and sub-ice water at 5 m depth (UIW5) at station R1 in Pierre Lejay Bay from 1 November (day 1) to 29 December 2001 (day 59).
![Fig. 8 Temporal variations of (a) salinity, (b) silicic acid (Si[OH4]), (c) nitrite and (d) nitrate plus nitrite in bottom ice (Bi), platelet ice (Pi) and sub-ice water at 5 m depth (UIW5) at station R1 in Pierre Lejay Bay from 1 November (day 1) to 29 December 2001 (day 59).](/cms/asset/636b1edb-f3ee-40ac-a59d-d0cd689edace/zpor_a_11818810_f0008_ob.jpg)
Table 1 Environmental and biological variables (mean±standard deviation) recorded at station R1 in Pierre Lejay Bay from 1 November (day 1) to 29 December 2001 (day 59) in the bottom ice (Bi, 19 samples), platelet ice (Pi, 19 samples) and sub-ice water at 5 m depth (UIW5, 15 samples).
Fig. 9 Temporal variations of (a) phosphate , (b) chlorophyll (Chl) a, (c) phaeopigment (Phaeo) a concentrations and (d) pH in bottom ice (Bi), platelet ice (Pi) and sub-ice water at 5-m depth (UIW5) at station R1 in Pierre Lejay Bay from 1 November (day 1) to 29 December 2001 (day 59).
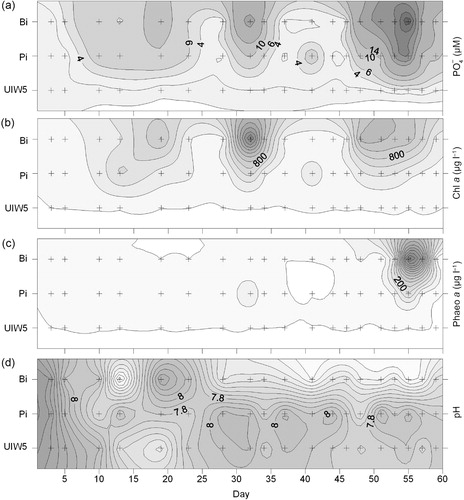
Fig. 10 Two-dimensional non-metric multidimensional scaling (MDS) of 40 samples based on standardized and log (x+1)-transformed selected variables (nutrients, pigments, salinity, pH), with three groups delineated: bottom ice (Bi), platelet ice (Pi) and 5-m sub-ice water (UIW5).
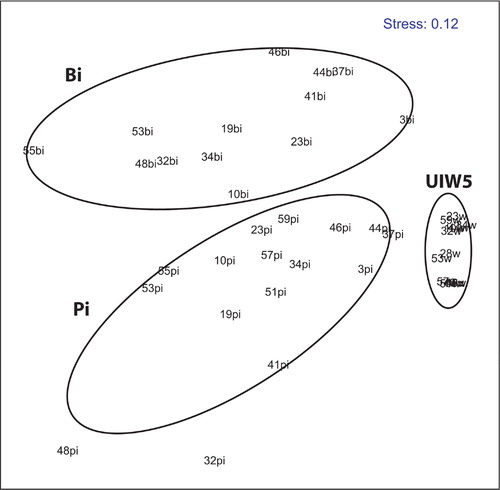
Table 2 Variables measured from the material collected on the sediment traps deployed from 8 November to 6 December 2001 at station R1 in Pierre Lejay Bay.
Fig. 11 Temporal variations in cell abundance of the dominant diatom species (a) Cylindrotheca closterium, (b) Nitzschia lecointei, (c) Navicula glaciei and (d) Amphiprora kufferathii in bottom ice (Bi), platelet ice (Pi) and sub-ice water at 5 m depth (UIW5) at station R1 in Pierre Lejay Bay from 1 November (day 1) to 29 December 2001 (day 59).
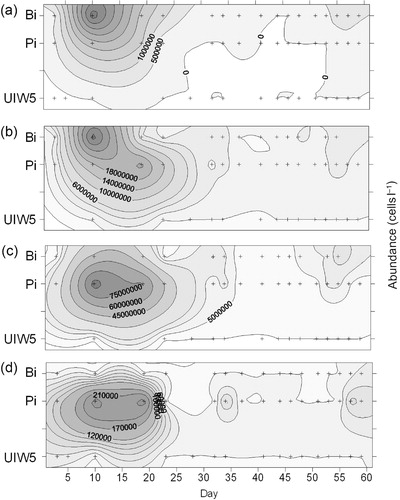
Table 3 Protist taxa reported from the bottom ice (Bi), platelet ice (Pi) and in the sub-ice water at 5 m depth (UIW5) at station R1 in Pierre Lejay Bay from 1 November (day 1) to 29 December 2001 (day 59). The species name abbreviations are those used in .
Fig. 12 Temporal variations in cell abundance of the dominant diatom species (a) Fragilariopsis cylindrus (a) F. sublinearis, (c) Nitzschia stellata, (d) Fragilariopsis curta, and (e) Berkeleya adeliensis in bottom ice (Bi), platelet ice (Pi) and sub-ice water at 5 m depth (UIW5) at station R1 in Pierre Lejay Bay from 1 November (day 1) to 29 December 2001 (day 59).
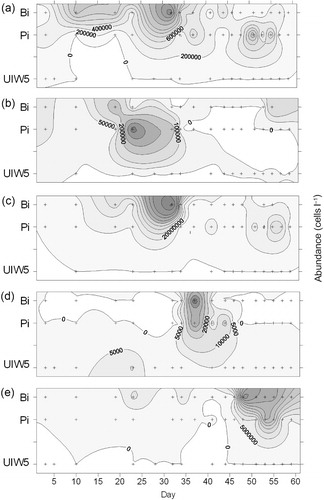
Fig. 13 Temporal variations in cell abundance for some other algal taxa (a) nanoflagellates (6–10 µm), (b) nanoflagellates (<5 µm), (c) Gymnodinium/Gyrodinium (<20 µm) and (d) Phaeocystis antarctica in bottom ice (Bi), platelet ice (Pi) and sub-ice water at 5-m depth (UIW5) at station R1 in Pierre Lejay Bay from 1 November (day 1) to 29 December 2001 (day 59).
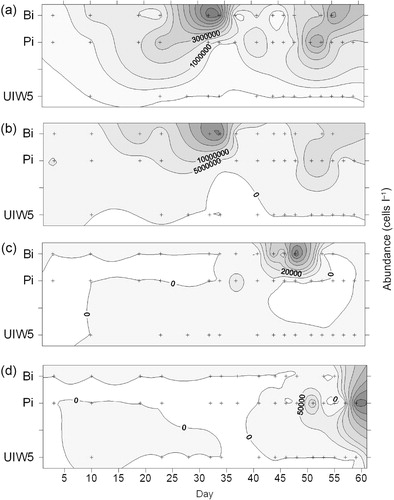
Fig. 14 Cluster using group-average linking on Bray–Curtis species (and microalgae groups) similarity from standardized abundance data. The most important species or morphotypes, with a contribution > 5%, were retained from the original list. Two groups—UIW5 (sub-ice water at 5-m depth) and Bi Pi (bottom ice and platelet ice algae)—defined at an arbitrary similarity level of 12%, are indicated. Nanoflagellates less than 5 µm are denoted as F5 and those in the size range of 6–10 µm are F6. See for the significance of the other abbreviations.
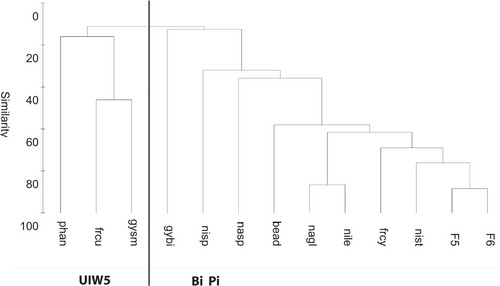
Table 4 Breakdown of similarities within groups into contributions from each taxonomic entity. Taxa are ordered by decreasing average contribution (contrib. %) to a total of 90 %. Average abundance (av. abund.): cells ml−1.
Table 5 Breakdown of dissimilarities between groups into contributions from each taxonomic entity. Taxa are ordered by decreasing average contribution (contrib. %) to a total of about 90 %. Average abundance (av. abund.): cells ml−1.
Table 6 Bottom ice spatial heterogeneity test at R1 in Pierre Lejay Bay in 1999 (unpubl. data), along a “Latin square” (625 m2), with duplicates at 3-m intervals at each of the five “Latin square” sites. Each coring site is defined by its position (in metres).