Figures & data
Fig. 1 The study areas in Adventdalen (Isdammen and Fivelflyene) and Hanaskogdalen, Svalbard, where evidence of grubbing was registered. The sampling plots (four in each transect; total n=76) in the 19 altitudinal transects are marked with black dots on the map. Illustration: Oddveig Øien Ørvoll, Norwegian Polar Institute, 2012.
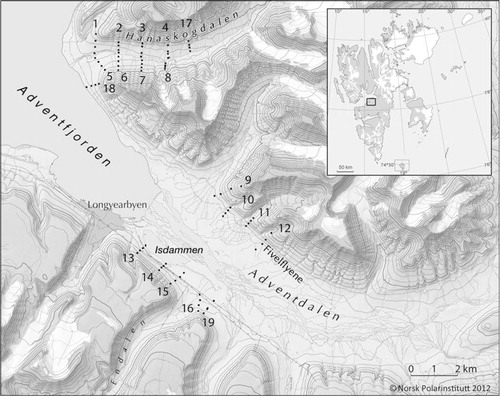
Table 1 Description of the eight habitat types sampled in the study plots (N=76). The habitat class number refers to one of the 18 habitat types described by Johansen et al. (Citation2012). In the statistical analysis, habitat types from group 1, 3 and 4 were re-classified to a major habitat class termed “dry habitat” and group 2 was termed “wet habitat.”
Fig. 2 Scatterplot showing the relations between altitude (m) and slope (degrees) for the dry and wet habitat types.
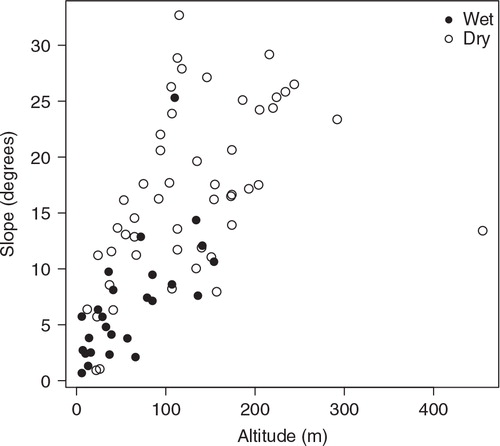
Table 2 Spearman's rank correlation matrix of continuous predictor variables which relate terrain characteristics to probability of goose grubbing in the study area. Significant correlations (P<0.05) are indicated with asterisks.
Fig. 3 Proportion of sampling frames grubbed in each sampling plot (no. frames grubbed/total no. sampling frames in study plot [8]) plotted against altitude (m) of the sampling plot.
![Fig. 3 Proportion of sampling frames grubbed in each sampling plot (no. frames grubbed/total no. sampling frames in study plot [8]) plotted against altitude (m) of the sampling plot.](/cms/asset/75aa568d-77a9-477e-97fc-693fa3267468/zpor_a_11818820_f0003_ob.jpg)
Fig. 4 Predicted probability of pink-footed goose grubbing per 0.25-m2 quadrat (solid black line) from the best logistic model on the predictor variable “aspect” for the two major habitat types (wet and dry). Dotted lines show standard errors.
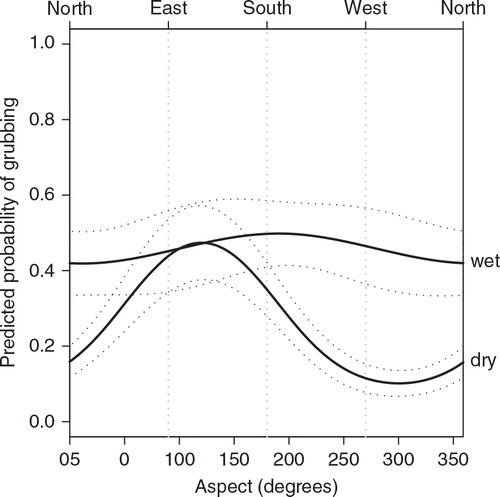
Table 3 Parameter estimates and standard error (± SE) for the five evaluated models describing the probability of goose grubbing in the study areas in Adventdalen and Hanaskogdalen, Svalbard, according to Akaike's Information Criterion corrected for small sample size (AICc) and ΔAICc. Reference level (intercept) was set to habitat type “dry.” Estimates are differences (contrasts) between the intercept and the estimated effect. Asterisks indicate statistically significant (P<0.05) estimates. The selected model for inference is in boldface. Coefficients for random effects and residual variability are standard deviations.