Figures & data
Fig. 1 Position of the Palaeogene Central Basin of Spitsbergen and location of the studied sections. Spitsbergen is the main island of the Svalbard Archipelago. This article is based on the Store Norske Spitsbergen Grubekompany (SNSG) core section BH9/05.
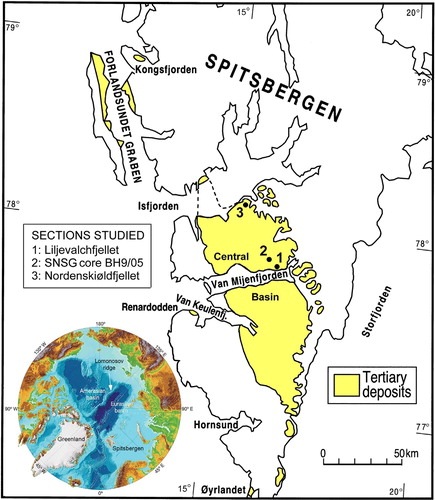
Fig. 2 Stratigraphic outline showing the sedimentary infill of the Paleogene Central Basin of Spitsbergen with subdivision into four depositional sequences.
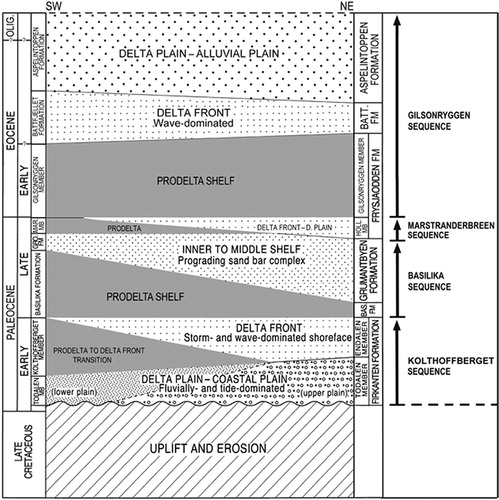
Fig. 3 Lithological column of the analysed Gilsonryggen Member (Frysjaoden Formation) logged in core BH9/05, with bioturbation trends illustrated by core pieces numbered to show their stratigraphic positions.
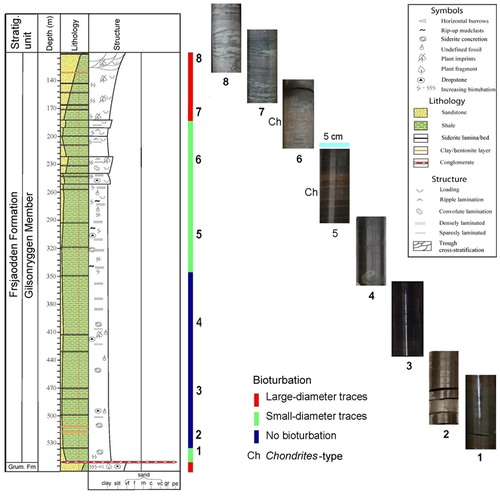
Fig. 4 Foraminiferal diversity portrayed as the number of species in core BH9/05 and subdivision into four assemblages. The Paleocene–Eocene Thermal Maximum (PETM) anomaly is marked with red shading.
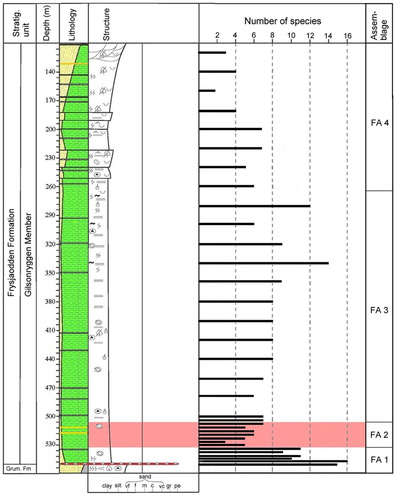
Fig. 5 Distribution of 20 foraminiferal species in core BH9/05. The Paleocene–Eocene Thermal Maximum (PETM) anomaly with a faunal turnover at its base is indicated, and the assemblage subdivision is marked. A total of 18 rare species are omitted.
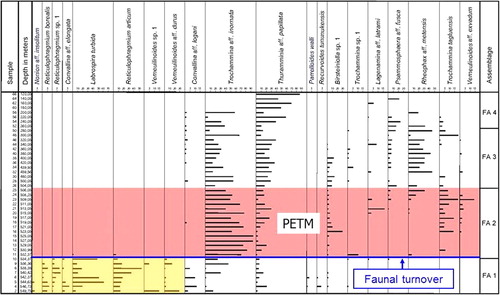
Fig. 6 Distribution of the H(S) diversity index of foraminifera in core BH9/05. The lowermost part of the Gilsonryggen Member with the Paleocene–Eocene Thermal Maximum (PETM) anomaly is also shown at an expanded scale.
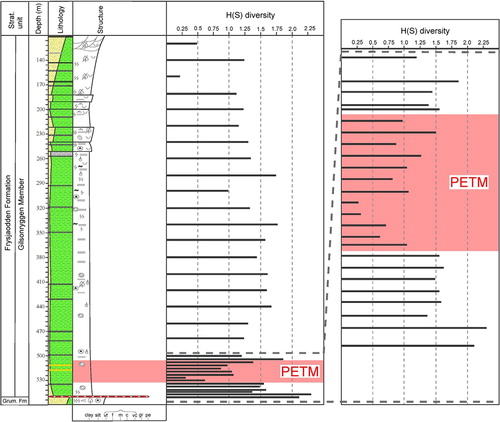
Fig. 7 Distribution of foraminiferal test surface area groups (SAG) in the lower 150 m of core BH9/05. The Paleocene–Eocene Thermal Maximum (PETM) anomaly (shaded) is characterized by reduced test dimensions shown by the high dominance of SAG-1.

Fig. 8 Distribution of foraminiferal morphogroups (MGs) in the lower 150 m of core BH9/05. The Paleocene–Eocene Thermal Maximum (PETM) anomaly (shaded) is typified by high dominance of the surface-dwelling group MG-3.
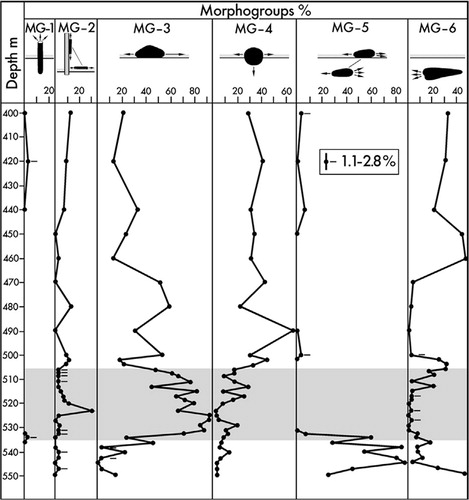
Fig. 9 Samples analysed from core BH9/05 plotted in an alpha versus H(S) diversity graph. All samples plot in the field of restricted environments. Samples from the Paleocene–Eocene Thermal Maximum (PETM) anomaly plot closest to the lower left corner suggesting highest restriction degree within the section.
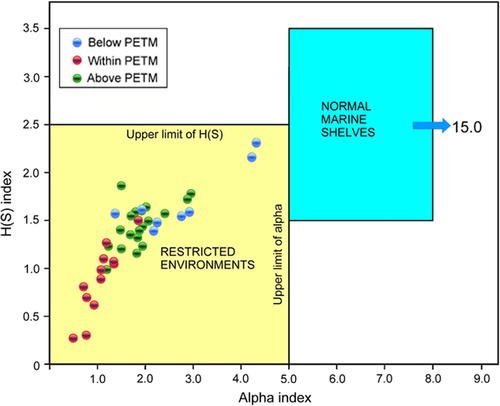
Fig. 10 Distribution of environmental proxies in core BH9/05 including H(S) diversity index, thorium/uranium ratio and kaolinite content. The Paleocene–Eocene Thermal Maximum (PETM) anomaly is shaded. (The plots of the latter two proxies are based on data from Dypvik et al. Citation2011.)
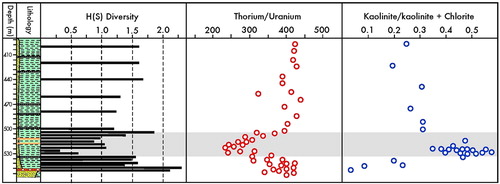
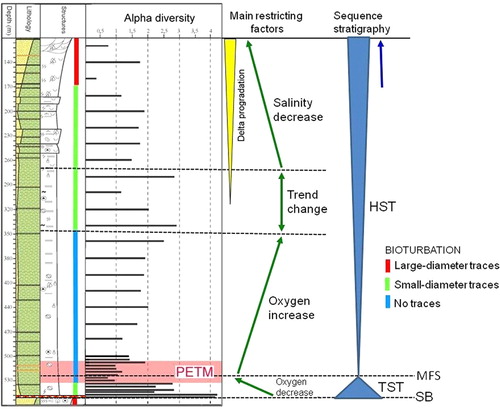
Fig. 11 Outline of biofacies trends combined with sequence stratigraphy of core BH9/05. The following terms are abbreviated: sequence boundary (SB), transgressive systems tract (TST), maximum flooding surface (MFS) and highstand systems tract (HST).