Figures & data
Fig. 1 Location and overview map of the Tarfala valley, including sites where air temperature was recorded (Tarfala Research Station) and where ground and air temperature were recorded (PACE). Contour interval is 50 m.
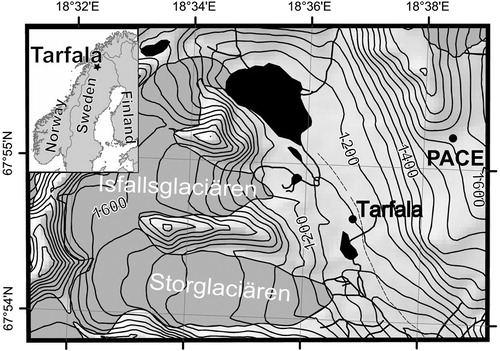
Fig. 2 Monthly means and annual means (including 5-year running mean) of the Tarfala Research Station air temperature record, 1965–2011.
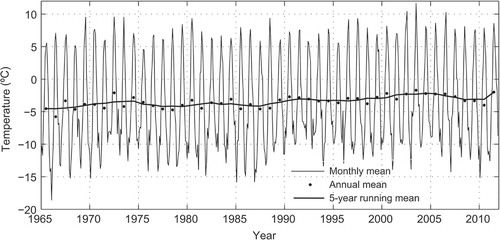
Fig. 3 Mean annual air temperature anomalies at Tarfala Research Station, 1965–2011, relative to the 1965–94 mean.
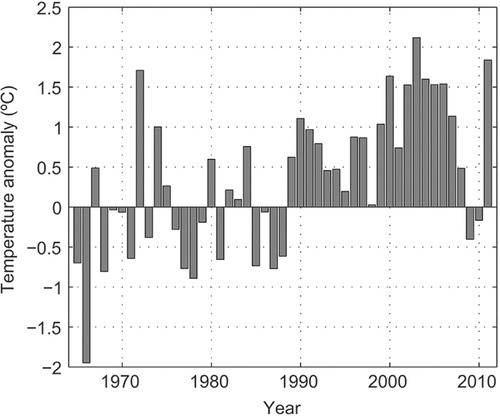
Table 1 Mean annual, seasonal and monthly air temperature at Tarfala Research Station 1995–2011 and 1965–1994, the temperature difference (δT) between the later and the earlier period and δT that is statistically significant at p=0.01 using ANOVA test.
Fig. 4 (a) Standard deviation (SD) of mean monthly air temperatures at Tarfala Research Station for the periods 1965–1994 and 1995–2011, and temperature trends for each month over the period 1965–2011. (b) Monthly temperature anomalies for the period 1967–2009 relative to the monthly mean temperature averaged over the period 1965–1994. Anomalies are computed from five-year running means.
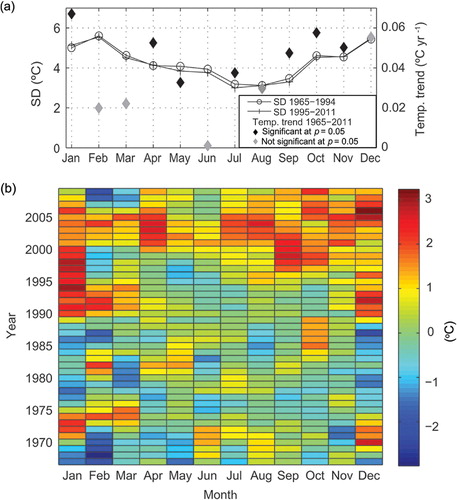
Fig. 5 Seasonal cycles of air temperature averaged over 10-year periods between 1965 and 2011. Note the last period (2005–11) only includes 7 years.
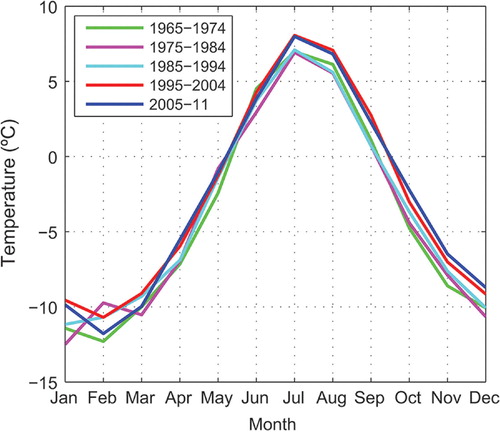
Fig. 6 Mean daily air temperature at Tarfala Research Station versus air temperature at the Permafrost and Climate in Europe (PACE) borehole site on Tarfala Ridge (). The solid line is a linear fit.
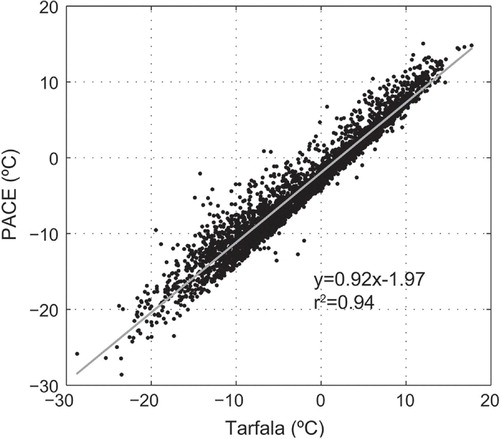
Fig. 7 Monthly mean air temperature lapse rates calculated from all available mean daily air temperature data from the Tarfala Research Station and the Permafrost and Climate in Europe (PACE) borehole site. Bars extend over±1σ based on all concurrent daily data.
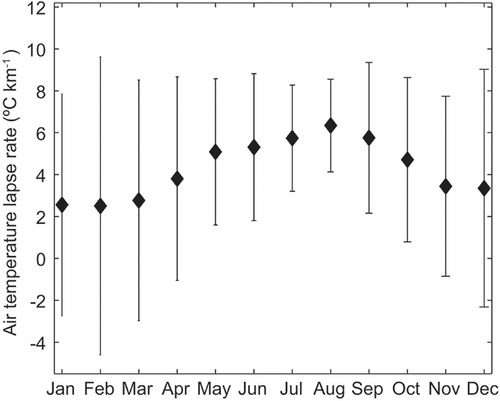
Fig. 8 Storglaciären's summer mass balances B s versus (a) mean summer temperatures and (b) annual positive degree–day sums for the period 1965–2011. The solid lines are linear fits of all data.
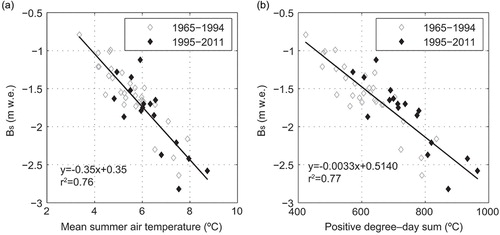
Fig. 9 Time series of (a) annual number of days with positive mean daily temperatures (PDD) and (b) positive degree–day sums (PDDS) at Tarfala Research Station, 1965–2011.
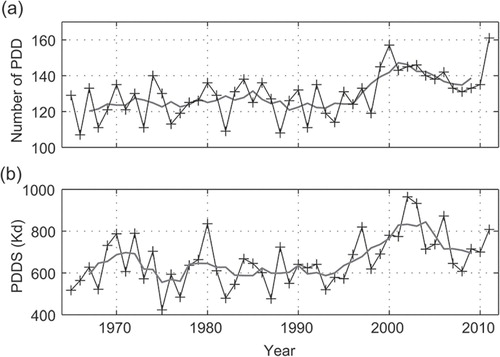
Fig. 10 Time series of (a) mean winter (DJF) air temperature at Tarfala Research Station and (b) North Atlantic Oscillation (NAO) index 1965–2011. Lines show five-year running means.
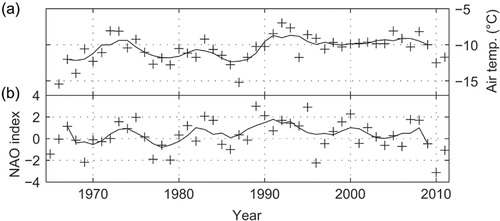
Table 2 Spearman rank correlation coefficient (r) and level of significance (p) for winter North Atlantic Oscillation index (DJF) versus Tarfala Research Station mean winter air temperature (DJF) for various periods. The first year given for each period includes data from the preceding December. For example, 1966 spans December 1965 through February 1966.
Fig. 11 Ground temperature of the Permafrost and Climate in Europe (PACE) borehole at 20-, 50-, 70- and 100-m depths between January 2001 and September 2011. Dots are smoothed daily mean temperature and lines indicate linear interpolations through data gaps.
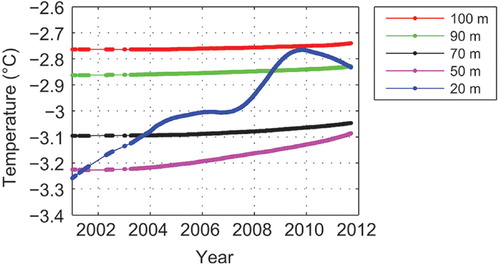
Fig. 12 Permafrost and Climate in Europe (PACE) borehole temperature profiles on 7 June for each year (a) to a depth of 20 m and (b) between 20 and 100 m depth.
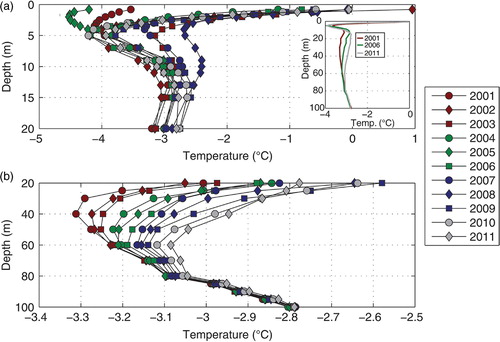
Fig. 13 Linear temperature trends over the period 2001–11 versus depth. Trends are not shown for the upper 20 m, where temperatures are affected by seasonal variations.
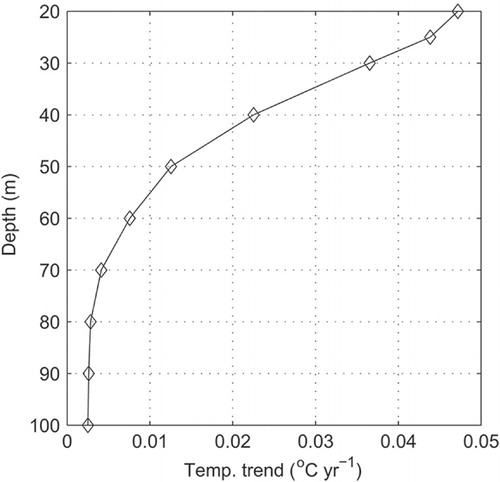
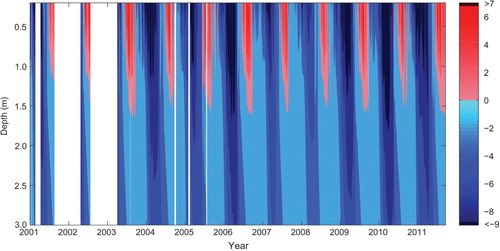
Fig. 14 Ground temperature (°C) between 0.2 and 3 m depth, 2001–11.