Figures & data
Fig. 1 Location of Cape Krusenstern National Monument. The study area lies just north of the Arctic Circle, and within the continuous permafrost zone (permafrost boundary after Jorgenson et al. Citation2008).
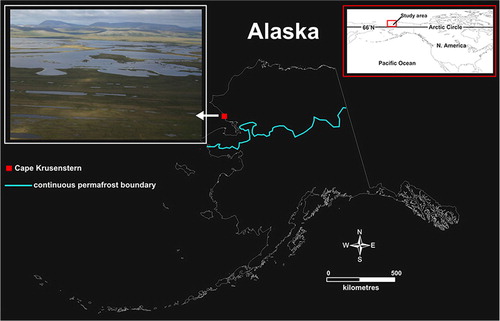
Fig. 2 Cape Krusenstern beach ridges and site location.
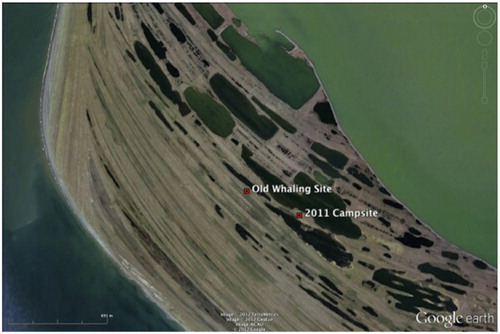
Fig. 3 Looking north towards a house pit in Giddings’ winter settlement. (Photo by Christopher Wolff.)
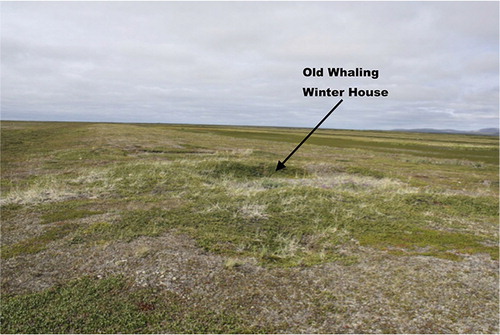
Fig. 4 The site presented a flat surface free of obstructions, making the deployment of geophysical instruments very easy. Shown here, Thomas Urban with Noggin ground-penetrating radar system. (Photo by Christopher Wolff.)
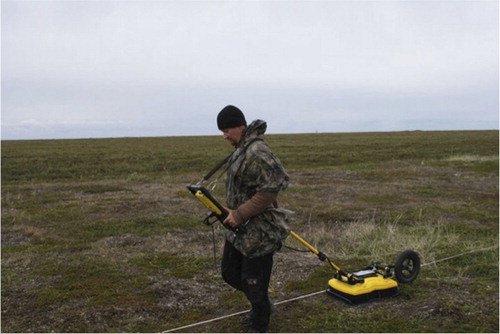
Fig. 5 Amplitude-slice image of ground-penetrating radar results revealing complex dendritic patchwork related to a combination of hydrologic and cryogenic processes in the active layer (i.e., above the permafrost layer).
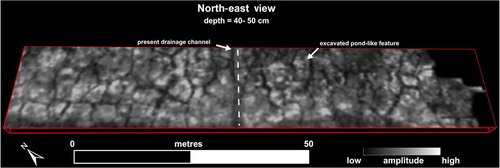
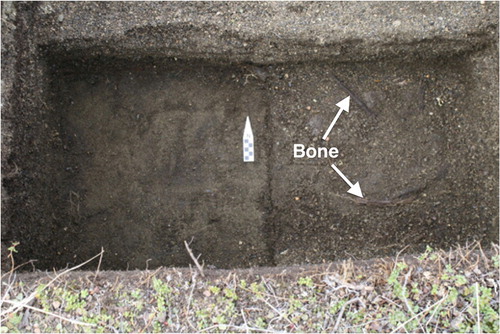
Fig. 6 Test excavation of the edge of sunken surface feature revealing fine sandy deposits (under north arrow) that naturally infilled a permafrost fissure.
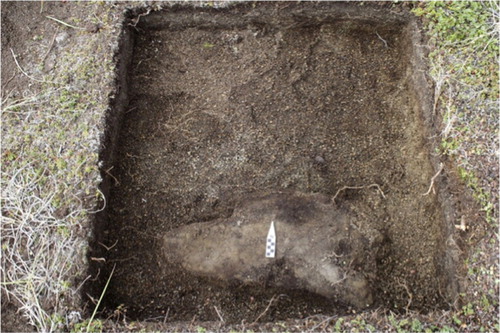
Fig. 7 In this comparison of magnetic and ground-penetrating radar results, the ground-penetrating radar image (lower) has undergone a spherical averaging filter to reduce clutter and emphasize strong trends. This is a true three-dimensional rendering with the upper 50 cm removed to reveal underlying features. The magnetic image (upper) incorporates a grey-scale rendering of the upward continued pseudo-gradient with a colour-contour map. The contour map uses the full range of magnetic data to indicate the locations of metal (contour interval = 3 nT/m) and demonstrate that features of interest are represented in only a very narrow range of the data.
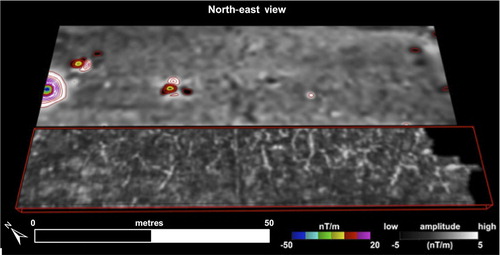
Fig. 8 Overlays of magnetic and ground-penetrating radar (GPR) results along entire survey area indicated a deeper trend from the underlying beach ridge.
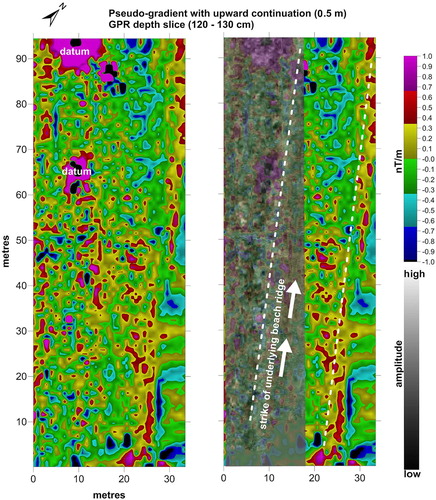
Fig. 9 The magnetic survey of the summer settlement revealed strong signals from the known houses and from various ferrous debris. The additional house documented by Darwent & Darwent (Citation2005) was not evident.
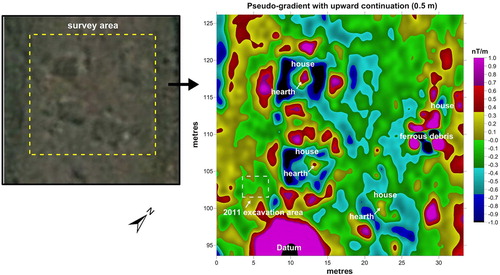
Fig. 10 Test excavation near winter house revealing probable midden deposits.