Figures & data
Fig. 1 Map of East Antarctica showing the sampling sites.
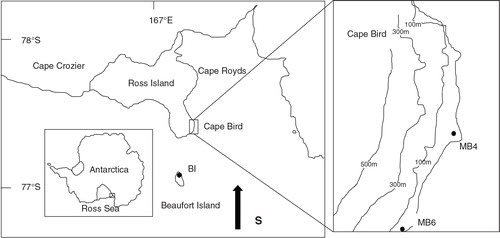
Fig. 2 Typical reflectance spectra curves of algae, guano and sediment samples, as well as the calculation method of trough area at 650–700 nm by Wolfe et al. (Citation2006). MB6-02 and MB6-40 are the sediment samples collected at depths of 1.2 and 24 cm in the MB6 profile, respectively. BI-01 is sampled at a depth of 0.5 cm in the BI profile.
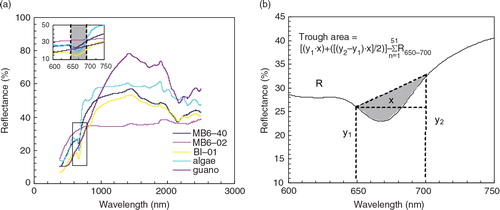
Fig. 3 Changes of 650–700 nm trough area, measured and inferred chlorophyll a concentrations and P levels in the BI, MB4 and MB6 sediment profiles.
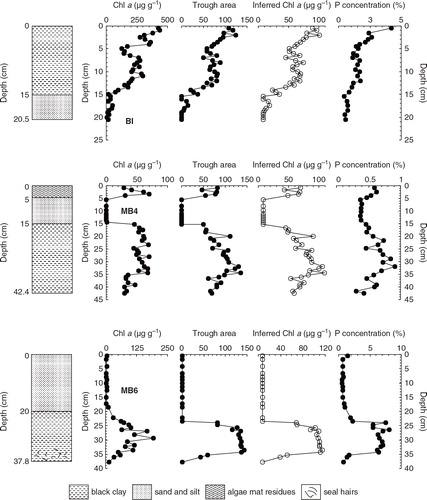
Fig. 4 Modelling relationship between the trough area at 650–700 nm and the measured chlorophyll a concentrations for the 32 samples from the three sediment profiles.
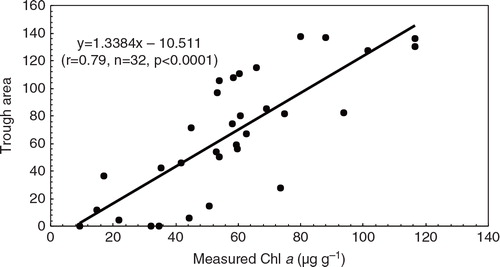
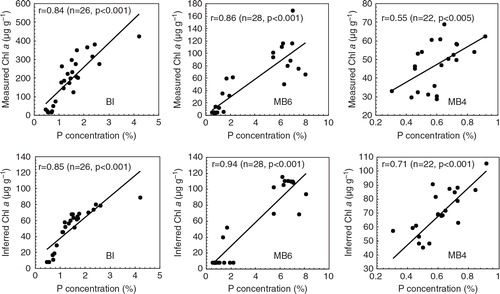
Fig. 5 Correlations of P with measured and inferred chlorophyll a concentrations in the ornithogenic sediments of BI, MB6 and MB4.