
Figures & data
Fig. 1 Location of the research area on the western coast of Admiralty Bay featuring sampling sites (nos. 1–15) where surface water samples were collected: 1 Lake Wujka (LW); 2 drinking water reservoir (DWR); 3, 4 Petrified Forest Creek (PFC); 5, 6, 7 Ornithologists Creek (OC); 8, 9 Czech Creek (CC); 10, 11 stream flowing along the border of Ecology Glacier (EG); 12, 13 Vanishing Creek (VC); 14, 15 stream flowing across the Wróbel Valley (WV).
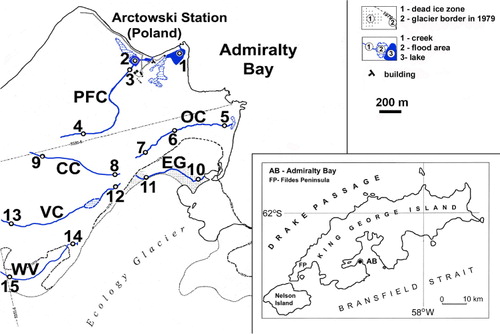
Fig. 2 Variability of pH at sampling stations at Ornithologists Creek: stream mouth (5); middle part of the stream (6); and stream source (7).
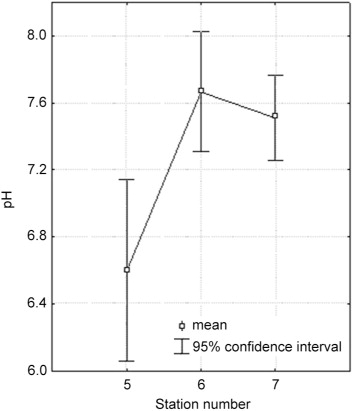
Fig. 3 Variability of total dissolved solids (TDS) at sampling stations at Ornithologists Creek: stream mouth (5); middle part of the stream (6); and stream source (7).
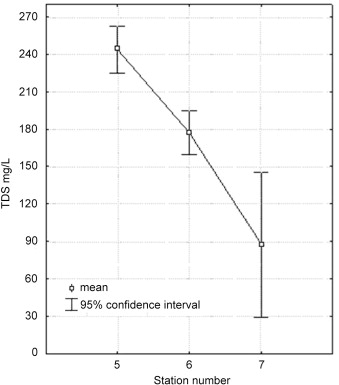
Table 1 Range and average values of the investigated physicochemical indicators in surface waters of the western coast of Admiralty Bay.
Fig. 4 The correlation between aluminium and iron in the investigated surface waters of the western coast of Admiralty Bay (statistically significant correlation coefficient).
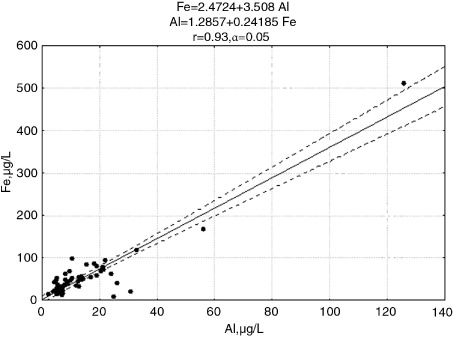
Fig. 5 The principal component analysis (PCA) results regarding all investigated metals. Taking into account the existing correlations, four groups of metals are distinguished: groups I, II and III included metals displaying very strong correlations within each group; group IV included metals which did not display strong correlations within the group. Total variation for the first two components equaled 49.87%.
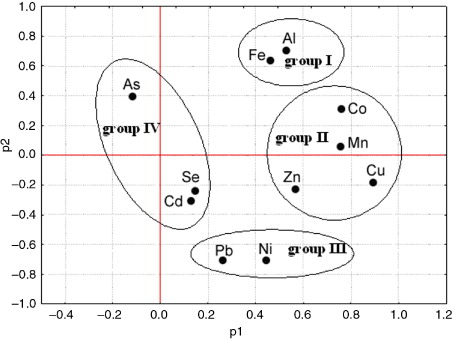
Table 2 Values of Pearson's correlation coefficient (r) regarding total concentrations of the investigated elements, physicochemical indicators and distance in the investigated surface waters. An asterisk indicates statistical significance at P<0.05.
Table 3 A comparison of total elements concentrations (average values) at the mouths and sources of the investigated streams.
Fig. 6 Results of principal component analysis of (a) dissolved elements and (b) total elements dividing surface waters into two groups: group I included the OC stream and the LW lake while group II included the remaining streams and the DWR (A – dissolved elements, B – total elements).
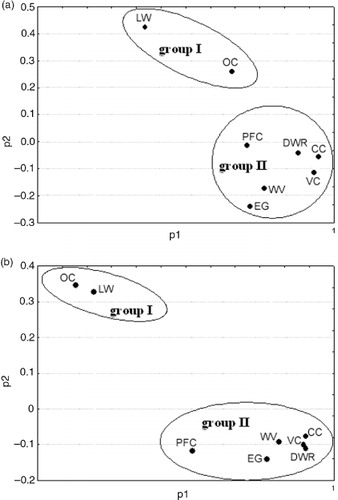
Table 4 Metal content in soils and volcanic rocks of Antarctica compared to metal content in Earth's crust (values in mg/kg, except Al and Fe in %).
Table 5 Annual fuel consumption and emission of selected metals resulting from fuel burned at the stations located on King George Island (data from Mishra et al. Citation2004).