Figures & data
Fig. 1 Absolute abundances of planktic foraminifera at 10 stations along a transect at 78°50′N across Fram Strait. Arrows—red for the West Spitsbergen Current and white for the East Greenland Current—indicate the ocean circulation in the study area. The white dashed line shows the position of the sea-ice margin in the transect during the sampling period (shipboard observation and satellite data from the US National Oceanic and Atmospheric Administration). Map source: the International Bathymetric Chart of the Arctic Ocean (Jakobsson et al. Citation2012).
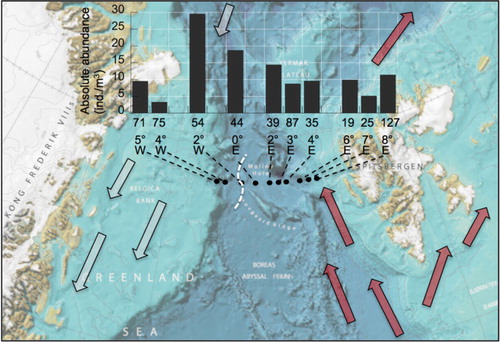
Fig. 2 Temperature and salinity of the water column in the upper 1000 m along a transect at 78°50′N across Fram Strait. Data obtained by conductivity–temperature–density measurements during the ARK XXVI/1 expedition (Beszczynska-Möller & Wisotzki Citation2012).
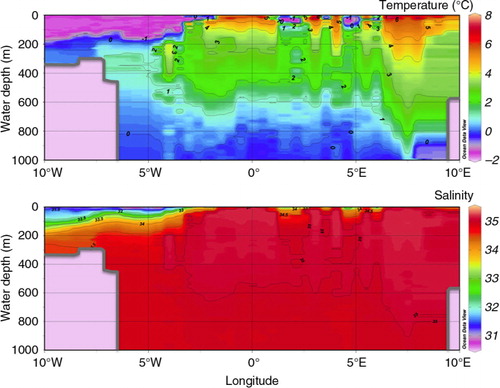
Table 1 List of the stations sampled during the ARKXXVI/1 cruise with the Polarstern in June/July 2011.
Fig. 3 Faunal composition of samples taken from the upper 500 m of the water column along a transect at 78°50′N in Fram Strait.
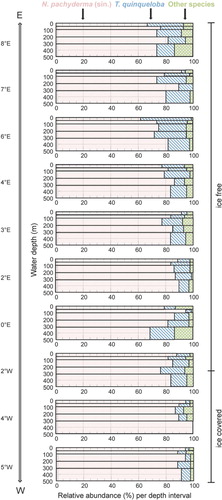
Fig. 4 Absolute (blue lines) and relative (black bars) abundances (percentage of total population of the given species at the given station per depth interval) of Neogloboquadrina pachyderma (sin.) and Turborotalita quinqueloba in the upper 500 m along a transect at 78°50′N in Fram Strait.
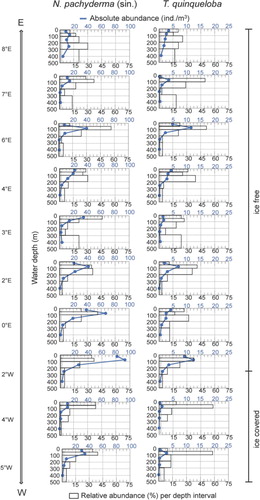
Fig. 5 Absolute abundances of planktic foraminifera on the sediment surface at 10 stations along a transect at 78°50′N across Fram Strait. The sample from station PS78-127 (8°E) did not hold enough individuals for counting.
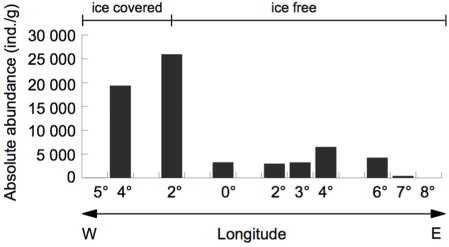
Fig. 6 Comparison of relative abundances of Neogloboquadrina pachyderma (sin.) and Turborotalita quinqueloba in the depth intervals 0–50 m and 50–100 m as well as on the sediment surface at 10 stations along a transect at 78°50′N in Fram Strait.
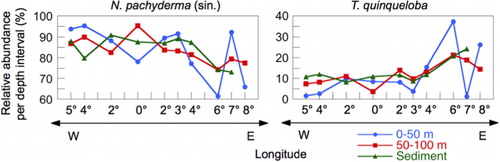
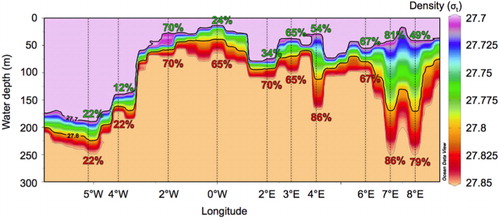
Fig. 7 The position of the isopycnal layer of 27.7–27.85 along the transect at 78°50′N across Fram Strait and relative abundance of Neogloboquadrina pachyderma (sin.) found in the depth intervals including the density range of 27.7–27.8 (green numbers at the top) and the range of 27.7–27.85 (red numbers at the bottom) at the 10 stations. Water density data obtained by conductivity–temperature–density measurements during the ARK XXVI/1 expedition (Beszczynska-Möller & Wisotzki Citation2012).