Figures & data
Fig. 1 Distribution and abundance of hermit crabs Pagurus spp. in the studied areas. Data on pelagic zoea larvae are from Węsławski et al. (Citation1991), Węsławski, Koszteyn et al. (Citation1999), Węsławski, Stempniewicz et al. (Citation1999), Kwasniewski et al. (Citation2010), Jakubas et al. (Citation2011), Kwasniewski et al. (Citation2012), Weydman et al. (Citation2013) and Gluchowska et al. (unpubl. ms.).
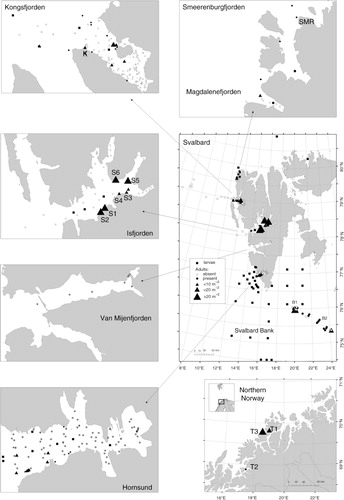
Table 1 Details of sampling campaigns. Abundance values are mean (±standard error) and, in italics, maximum abundance.
Fig. 2 Hermit crab occurrence and abundance in relation to depth and distance to glaciers.
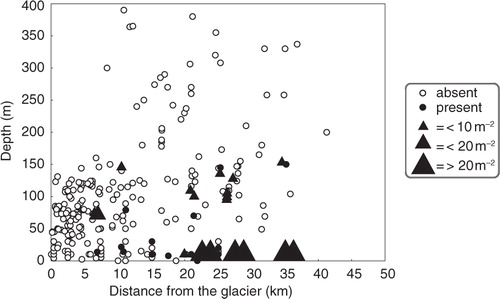
Fig. 3 Mean values with standard errors of hermit crab (Pagurus spp.) abundance at different depths and bottom types. Only samples collected in shallow subtidal (depths down to the 20 m) are presented.
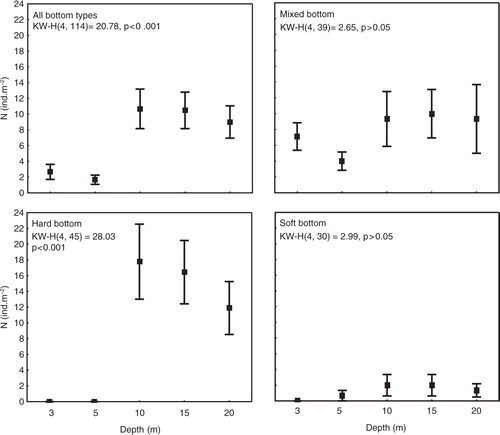
Fig. 4 Shield length and wet mass of hermit crabs (open squares, Pagurus bernhardus; filled squares, P. pubescens) collected at sites in northern Norway (T1, T2, T3), the Svalbard Bank (B1, B2) and Spitsbergen (S1, S2, S3, S4, K, SMR). Mean values with standard errors and results of a Kruskal-Wallis test for difference among sites are presented.
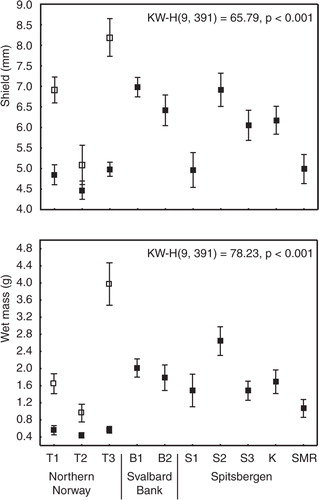
Table 2 Shell use by Pagurus pubescens (Pp), P. bernhardus (Pb) at sites in northern Norway, at the Svalbard Bank and on Spitsbergen. Pp and Pb in boldface denotes more than five individuals; normal type represents five or fewer individuals.
Fig. 5 Species accumulation curves of gastropod shells types used by hermit crabs.
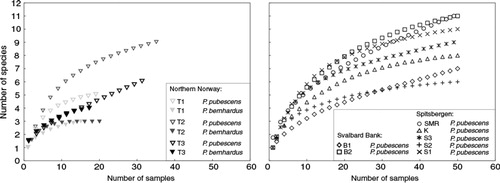
Fig. 6 Percentage of shell used by five hermit crab size classes in different areas. Above each column number of collected individuals is presented.
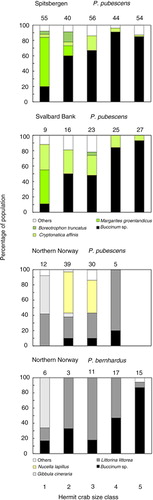
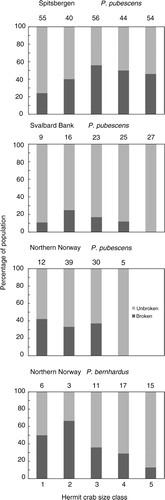
Fig. 7 Percentage of broken shell used by five hermit crab size classes in different areas. Above each column number of collected individuals is presented.