Figures & data
Fig. 1 The sub-Antarctic Kerguelen Islands and the locations of the study sites.
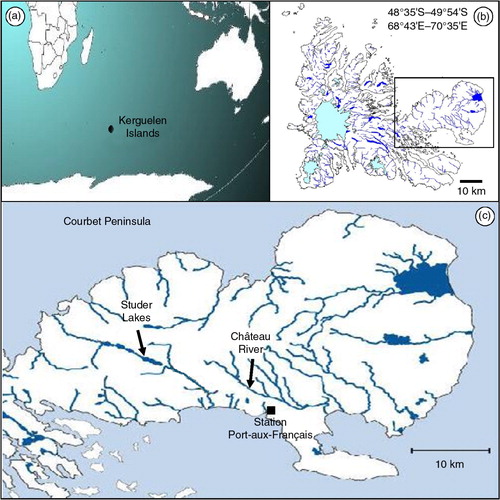
Table 1 Water physico-chemical characteristics of sampling sites. Values are expressed as mean and extreme values (minimum–maximum). Some values were not determined (nd) or are not available (NA).
Fig. 2 (a) Copper and (b) cadmium concentrations in livers of brown trout from the Kerguelen Islands from three Kerguelen morphotypes: river (n=10), lake (n=24) and station (n=54). Bars represent mean±SD of metal concentrations measured in the whole sample, in the livers of females and males in each morphotype. The different letters indicate significant differences in hepatic metal mean measured in the whole sample between the three morphotypes (Kruskal–Wallis test). Asterisks indicate significant differences in mean between females and males in each morphotype (Mann–Whitney U test).
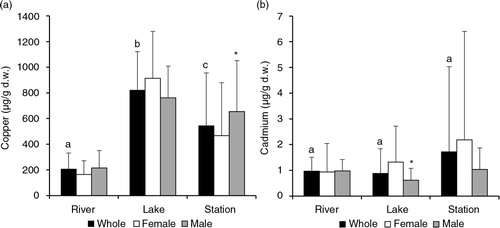
Fig. 3 Photomicrographs of liver sections from brown trout from the Kerguelen Islands illustrating (a, b) normal parenchyma. (c–f) Important numbers of melanomacrophage centres (MMC). The following terms are abbreviated: parenchyma (PAR), vein (V), biliary duct (bd); MMC; fibrosis (F), necrotic hepatocyte (nh); altered nucleus (an); erythrocyte (e), lipidic droplet (ld). The dotted line represents the MMC boundary. The scale bars are 40 µm in length.
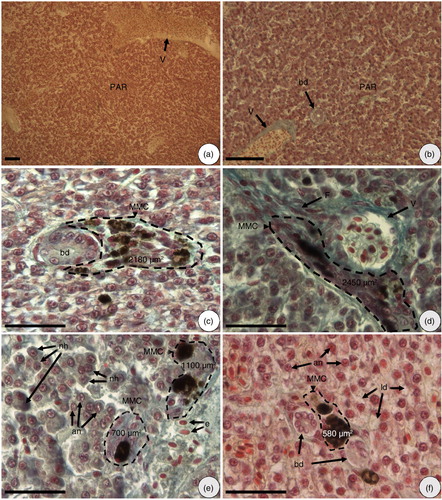
Fig. 4 Photomicrographs of liver sections from brown trout from the Kerguelen Islands showing different alterations: (a) fibrosis, (b) fibrosis with melanomacrophage centres (MMC), (c, d) altered nucleus, (e) parenchyma with lipidic droplet and (f) parenchyma with immune cell infiltrations. The following terms are abbreviated: fibrosis (F), necrotic biliary duct (nbd), vein (V), MMC, altered nucleus (an), biliary duct (bd), lipidic droplet (ld), necrotic hepatocyte (nh), immune cell agglomerate (ica). The scale bars are 40 µm in length.
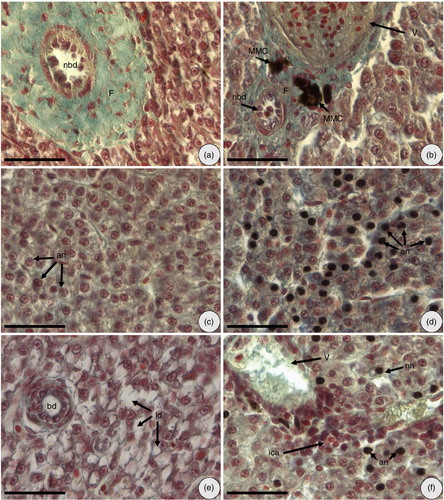
Table 2 Histological alterations observed in male and female Kerguelen brown trout from “river,” “lake” and “station” morphotypes. Values are expressed as mean (minimum–maximum). The different letters indicate significant differences for each alteration (Kruskal–Wallis test, p<0.05), with the number of observations in parentheses.
Table 3 Pearson correlation coefficients among hepatic metal concentrations and biomarkers. Values in boldface indicate significant correlations at p<0.05.
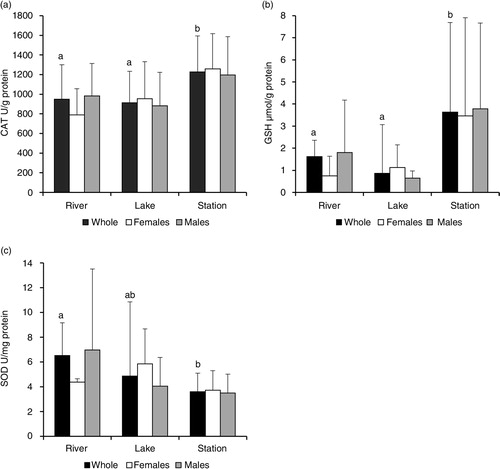
Fig. 5 (a) Catalase activity (CAT), (b) glutathione levels (GSH) and (c) superoxide dismutase activity (SOD) in the livers of brown trout from three Kerguelen Island morphotypes: river (n=17), lake (n=20) and station (n=21). Bars represent mean±SD of biomarker levels measured in the whole sample, in the liver of females and males in each morphotype. The different letters indicate significant differences in biomarker levels measured in the whole sample between the three morphotypes (Kruskal–Wallis test).