Figures & data
Fig. 1 Locations of sampling sites (white dots) in the (a) Arctic Ocean and the (b) Southern Ocean.
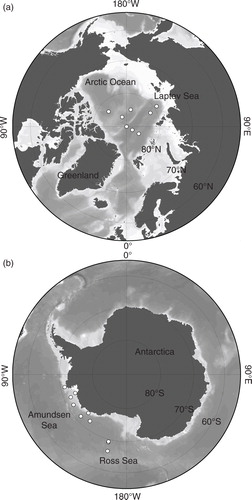
Table 1 Number of reads and defined operational taxonomic units (OTUs) assigned to the major taxonomic groups.
Fig. 2 Venn diagrams showing the overlap of operational taxonomic units (98% similarity level) between the two polar regions for (a) all four groups; (b) haptophytes; (c) chlorophytes; (d) stramenopiles; and (e) alveolates.
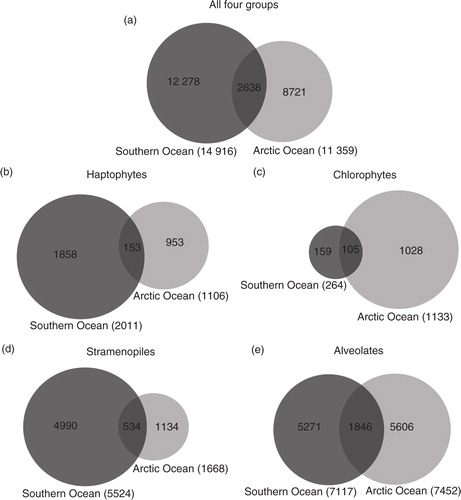
Fig. 3 Colour-coded matrix plot, illustrating the relative read abundance of abundant operational taxonomic units (OTUs) (abundance ≥1%) for (a) haptophytes; (b) stramenopiles; (c) chlorophytes; and (d) alveolates in the Arctic Ocean (AO) and the Southern Ocean (SO). White boxes indicate the absence of the respective OTU. The green stars indicate the two OTUs that occurred in the abundant biosphere in both regions.
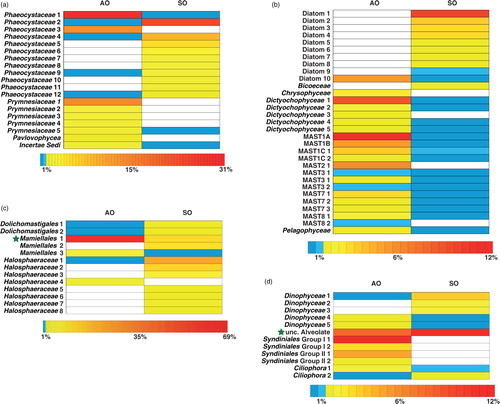
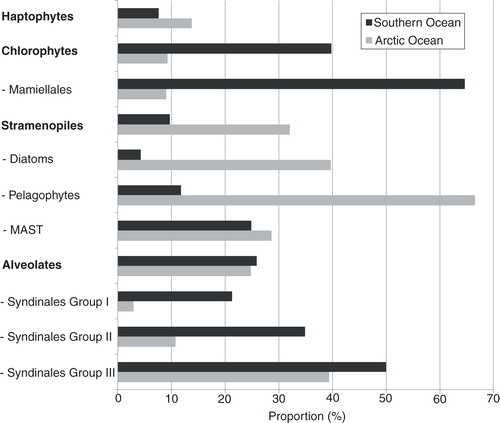
Fig. 4 Proportion of common operational taxonomic units (occurring in both polar regions) within the different groups.