
Figures & data
Fig. 1 Snow and firn sampling sites in Svalbard: Holtedahlfonna (HF); Kongsvegen (KV); Lomonosovfonna (LF); and Austfonna (AF). The means and
(bracketed) measured in snow in this paper are shown for each site (±1σ; units of ‰). Shaded relief map from the Advanced Spaceborne Thermal Emission and Reflection Radiometer (ASTER) global digital elevation model; glacier outlines from Nuth et al. (Citation2013).
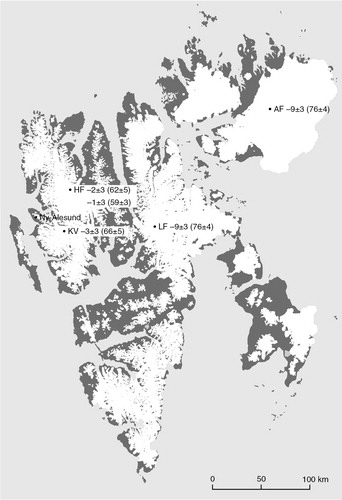
Table 1 Details of the snow and firn sampling sites across Svalbard.
Fig. 2 West-to-east variations in mean non-sea salt (nss) ion concentrations measured in Svalbard snow pits and firn cores at Holtedahlfonna (HF), Kongsvegen (KV), Lomonosovfonna (LF) and Austfonna (AF).
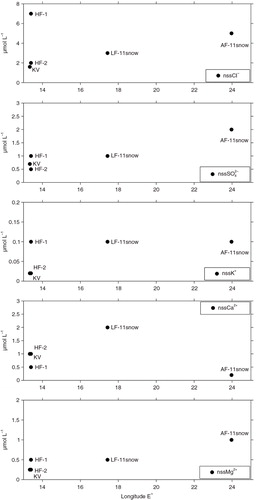
Table 2 Mean concentrations (charge equivalents;±σ) of major ions in seasonal snow at the sampling sites at Holtedahlfonna (HF), Kongsvegen (KV), Lomonosovfonna (LF) and Austfonna (AF), Svalbard. For [], see Table 4.
Fig. 3 West-to-east variations in the mean [],
and
determined in Svalbard snow pits and firn cores at Holtedahlfonna (HF), Kongsvegen (KV), Lomonosovfonna (LF) and Austfonna (AF). For AF-11, the
and
values shown were determined from firn core samples as values in seasonal snow could not be obtained.
![Fig. 3 West-to-east variations in the mean [], and determined in Svalbard snow pits and firn cores at Holtedahlfonna (HF), Kongsvegen (KV), Lomonosovfonna (LF) and Austfonna (AF). For AF-11, the and values shown were determined from firn core samples as values in seasonal snow could not be obtained.](/cms/asset/f3915613-b361-42ee-958d-e8c0fd8eec3f/zpor_a_11818916_f0003_ob.jpg)
Table 4 Mean values (±σ) of ,
and [NO3] in seasonal snow at the sampling sites at Holtedahlfonna (HF), Kongsvegen (KV), Lomonosovfonna (LF) and Austfonna (AF), Svalbard.
Table 3 Non-sea salt (nss) ion concentration (charge equivalents;±σ) at the sampling sites at Holtedahlfonna (HF), Kongsvegen (KV), Lomonosovfonna (LF) and Austfonna (AF), Svalbard.
Fig. 4 Altitudinal variations in (a) the estimated snow accumulation rate for winter 2010/11; and mean values of (b) [] (µmol L−1), (c)
(‰) and (d)
(‰) in snow and firn at Holtedahlfonna (HF), Kongsvegen (KV), Lomonosovfonna (LF) and Austfonna (AF).
![Fig. 4 Altitudinal variations in (a) the estimated snow accumulation rate for winter 2010/11; and mean values of (b) [] (µmol L−1), (c) (‰) and (d) (‰) in snow and firn at Holtedahlfonna (HF), Kongsvegen (KV), Lomonosovfonna (LF) and Austfonna (AF).](/cms/asset/1185f693-2746-4837-816f-4fd8ab51b810/zpor_a_11818916_f0004_ob.jpg)
Fig. 5 Clustered mean five-day back-trajectories of air masses arriving at Austfonna, Nordaustlandet, calculated for 86 precipitation events recorded between 12 August 2010 and 23 April 2011. Data from the Global Data Assimilation System (GDAS).
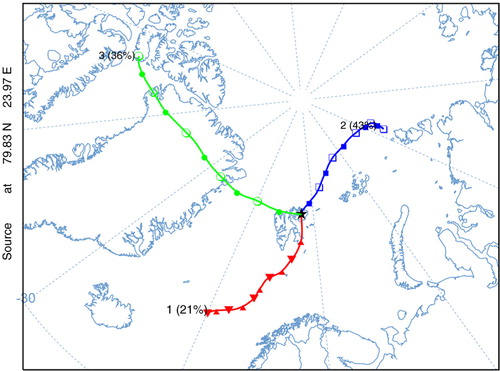
Fig. 6 Five-day back-trajectory for a precipitating air mass arriving at Austfonna, Nordaustlandet, on 6 February 2011. Data from the Global Data Assimilation System (GDAS) using the National Oceanic and Atmospheric Administration's Hybrid Single-Particle Lagrangian Integrated Trajectory model (HYSPLIT).
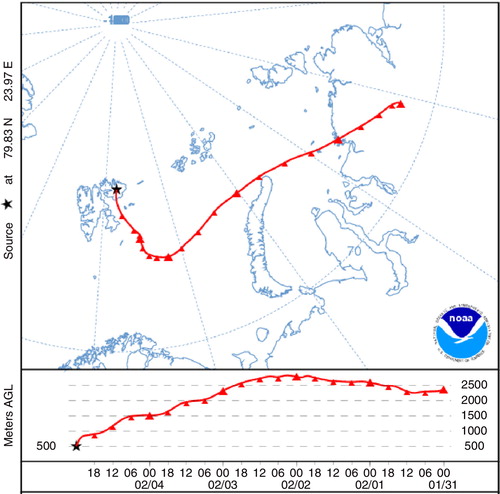
Fig. 7 Clustered mean five-day back-trajectories of air masses arriving at Holtedahlfonna, Spitsbergen, calculated for 54 precipitation events recorded between 12 August 2010 and 23 April 2011. Data from the Global Data Assimilation System (GDAS).
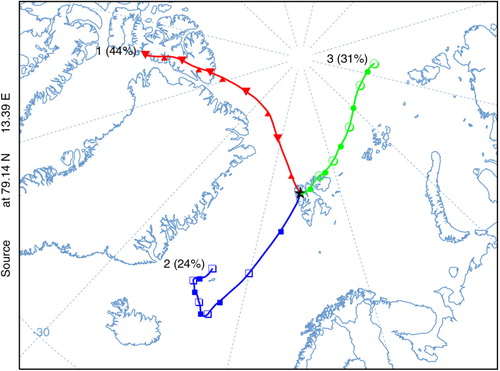
Fig. 8 Five-day back-trajectory for a precipitating air mass arriving at Holtedahlfonna, Spitsbergen, on 4 October 2010. Data from the Global Data Assimilation System (GDAS) using the National Oceanic and Atmospheric Administration's Hybrid Single-Particle Lagrangian Integrated Trajectory model (HYSPLIT).
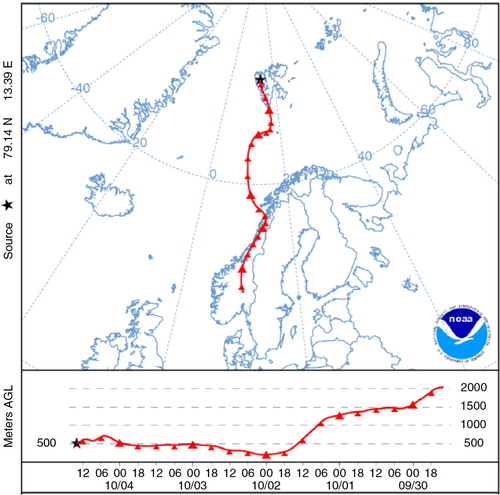
Fig. 9 Five-day air mass back-trajectories for the snowfall events reported by Heaton et al. (Citation2004) at Ny-Ålesund during (a) 2001 and (b) 2002. Data from the Climate Diagnostics Center (CDC) using the National Oceanic and Atmospheric Administration's Hybrid Single-Particle Lagrangian Integrated Trajectory model (HYSPLIT).
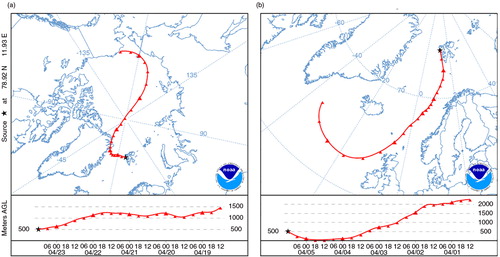
Fig. 10 Comparison of estimated seasonal mean values (±1σ) of (a) [], (b)
and (c)
in snowpits at sampling sites across Svalbard: Holtedahlfonna (HF), Kongsvegen (KV), Lomonosovfonna (LF) and Austfonna (AF). The [
] measured in snowfall at Ny-Ålesund in 2001 and 2002 and reported by Heaton et al. (Citation2004) is marked with horizontal arrows.
![Fig. 10 Comparison of estimated seasonal mean values (±1σ) of (a) [], (b) and (c) in snowpits at sampling sites across Svalbard: Holtedahlfonna (HF), Kongsvegen (KV), Lomonosovfonna (LF) and Austfonna (AF). The [] measured in snowfall at Ny-Ålesund in 2001 and 2002 and reported by Heaton et al. (Citation2004) is marked with horizontal arrows.](/cms/asset/8ffd25f1-b959-4d8b-9948-d7b86c20587c/zpor_a_11818916_f0010_ob.jpg)
Fig. 11 (a) Annual mean values of (a) [], (b)
and (c)
measured in the AF-11 and LF-11 firn cores from Austfonna and Lomonosovfonna, respectively. The resolution of the isotopic measurements in the cores is 1.8 samples a−1. The mean error in the dating of the cores was estimated as ±0.7 a.
![Fig. 11 (a) Annual mean values of (a) [], (b) and (c) measured in the AF-11 and LF-11 firn cores from Austfonna and Lomonosovfonna, respectively. The resolution of the isotopic measurements in the cores is 1.8 samples a−1. The mean error in the dating of the cores was estimated as ±0.7 a.](/cms/asset/0d89f560-394e-45be-bcb4-23d0fb8722ac/zpor_a_11818916_f0011_ob.jpg)