
Figures & data
Fig. 1 Fram Strait, sampling sites (Fram Strait transect, black line; including the Hausgarten station, small dashed rectangle). Large dashed rectangle shows data taken for long-term analyses of chlorophyll a from satellite (1998–2012) and from field samples (1991–2012). The northern warm Atlantic Current (NwAC) converts to the West Spitsbergen Current (WSC) flowing northward west of Svalbard into the Arctic Ocean. One branch of the WSC returns in the middle to western Fram Strait, forming the Returning Atlantic Current (RAC). In the western Fram Strait, the East Greenland Current (EGC) transports cold polar water southward.
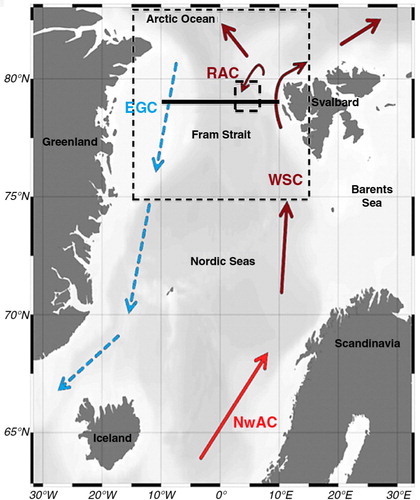
Fig. 2 Time series of the monthly means of satellite-retrieved GlobColour chlorophyll a averaged for the Fram Strait area for April–August 1998–2012 in (a) the East Greenland Current, 76° N–84° N, 15° W–0°, and (b) the West Spitsbergen Current 76° N–84° N, 0°–15° E. The data for every growth period always start with April and end with August.
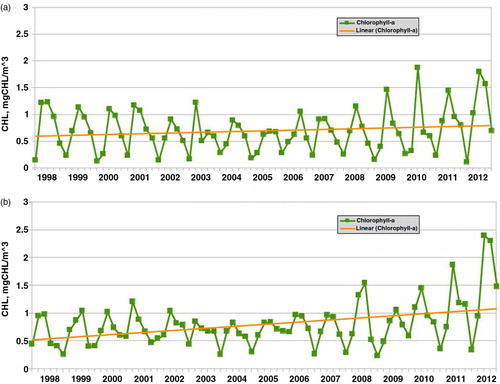
Table 1 Overview of the long-term data sets in the Fram Strait area and overview of the measured parameters during two RV Polarstern cruises in 2010 and 2011. More details are shown in Supplementary Tables S1 and S2.
Fig. 3 Phytoplankton biomass expressed as integrated chlorophyll a values for the upper 100-m water column given as mean for all stations occupied in the respective year from 1991 to 2012 in (a) the East Greenland Current and (b) the West Spitsbergen Current. Samples were taken in June/July for the years 1991, 1994, 1997, 2000, 2001, 2004 and 2007–2012 and in September/October for the years 1995, 1998, 1999, 2000, 2001, 2003 and 2006.
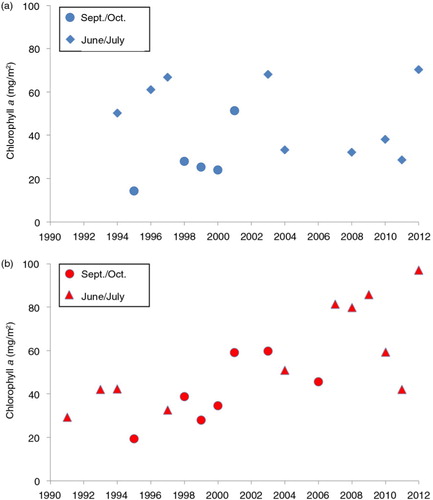
Table 2 Composition of unicellular planktonic protists (larger than 3 µm) in % (all above 1% are shown) of total abundance in the chlorophyll a maximum of the water column stations close to the Hausgarten central station at about 79° N and 4° E for eight years between 1998 and 2011.
Fig. 4 (a, b) Sea-ice concentration and (c, d) chlorophyll concentration of satellite GlobColour chlorophyll a, which is the monthly mean data (from the Medium Resolution Imaging Spectrometer, Moderate Resolution Imaging Spectroradiometer and Sea-Viewing Wide Field-of-View Sensor) for July within the Fram Strait area (76° N–84° N, 25° W–15° E) for the year (a, c) 2010 and (b, d) 2011. Daily sea-ice concentration (SIC) maps were provided by the PHAROS group of the University of Bremen (Spreen et al. Citation2008). SIC data were retrieved from the Advanced Microwave Scanning Radiometer–Earth Observing System data with a spatial resolution of 6.25 km. Satellite chl a level-3 data were taken from the GlobColour archive (www.hermes.acri.fr); the colour scale is from 0 to 1.0 mg chl a m−3. (For data for all months in 2010 and 2011, see Supplementary Fig. S2.). The white dashed lines represent the transect.
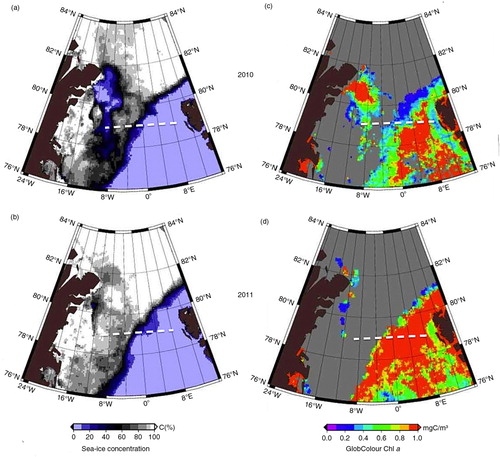
Fig. 5 (a) Section across Fram Strait, with the RV Polarstern, showing temperature, salinity and nutrients—nitrate (NO3 µM), silicate (Si µM)—(a) on the ARK XXV/2 cruise during 2–23 July 2010 and (b) on the ARK XXVI/1 cruise during 26 June–10 July 2011. (Figure generated with Ocean Data view, R. Schlitzer, www.odv.awi.de, 2015. For more details see Supplementary Fig. S3.)
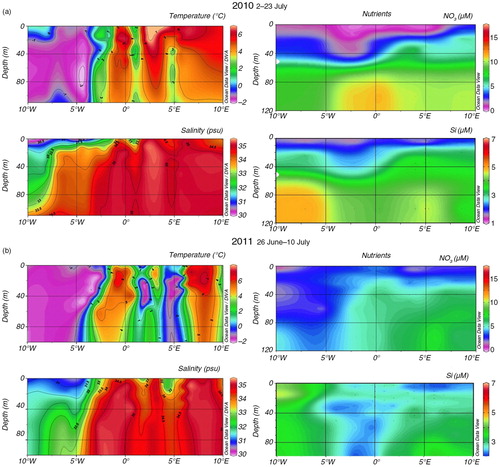
Fig. 6 Contour plots of the section at ca. 79° N for the sampling periods in (a) 2010 and (b) 2011 based on high-performance liquid chromatography data. Depicted are 100 m for chlorophyll a mg/m−3 and 50 m for the following marker pigments: peridinin for dinoflagellates, 19-hexanoyloxyfucoxanthn (19-hex) for haptophytes and fucoxanthin for diatoms, all in nanogram per litre. Note changing concentrations of the marker pigments: higher concentrations of all marker pigments were observed in 2010. The three main water masses indicated are cold Polar Water (PW), mixed water (MW) and warm northern Atlantic Water (AW). (Figure generated with Ocean Data view, R. Schlitzer, www.odv.awi.de, 2015.)
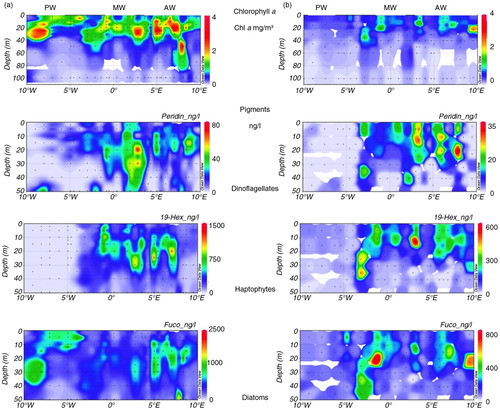
Fig. 7 (a) Total bacterial abundance and (b) the percentage of high nucleic acid (HNA) cells in surface samples at 79° N collected in summer 2010 and 2011. The three main water masses indicated are cold Polar Water (PW), mixed water (MW) and warm northern Atlantic Water (AW).
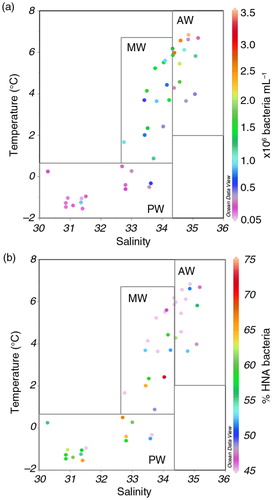
Fig. 8 Principal component analysis of environmental factors that presented a significant correlation with the grouping of protist communities based on the ARISA profiles. Protist community structure relations were computed by the implementation of the Jaccard index (stress=0.14). Environmental factors were tested for significance using a permutation test (envfit function; R software). All stations were located at 78° 48′ N. Stations (ARK XXV/2, 2010) in the West Spitsbergen Current (WSC) ranged between 9° 3′ E and 2° 1′ W; in the mixed water (MW) between 3° 5′ and 8° 0′ W and in the East Greenland Current (EGC) between 8° 6′ and 11° 6′W. Numbers of sampling stations on boldface were further used for subsequent 454-pyrosequencing analysis. (Results of 454-pyrosequencing are available in Supplementary Fig. S4.)
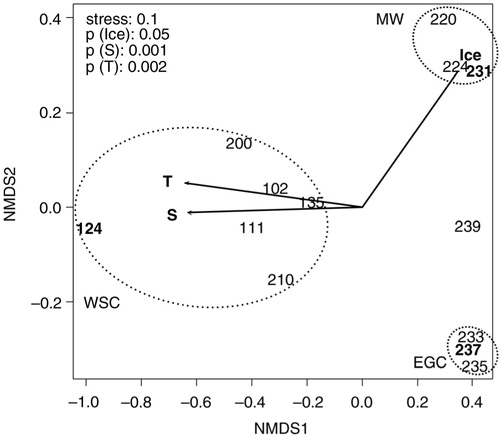
Table 3 Water mass–related appearance of dominant copepod and amphipod species during summer 2011 zooplankton investigations onboard the RV Polarstern across the 78° 48′ N Fram Strait transect. At stations influenced by warm and saline Atlantic Water, the North Atlantic species Calanus finmarchicus clearly dominated the copepod population, while the boreal–Atlantic species Themisto abyssorum dominated the local amphipod community. In contrast, the typical Arctic copepod C. hyperboreus and the Arctic amphipod species T. libellula had a higher share at the mixed water and the Polar Water station.