
Figures & data
Fig. 1 Central Arctic Ocean with stations named from Julian days. The yellow line demarcates the water masses of Pacific origin above the line and of Atlantic origin below.
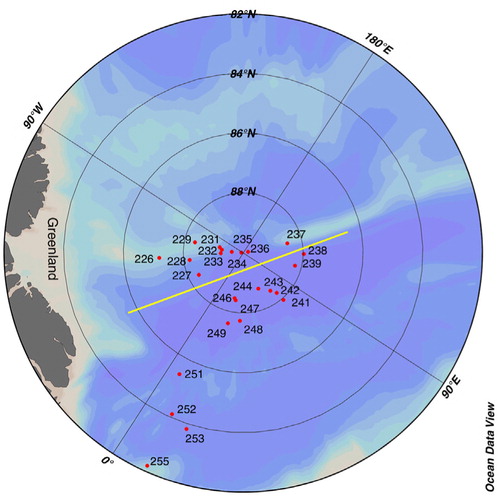
Fig. 2 Station 227 on 14 August with frozen melt ponds and the top of the ice core with a clear layer of deteriorated ice from station 246.
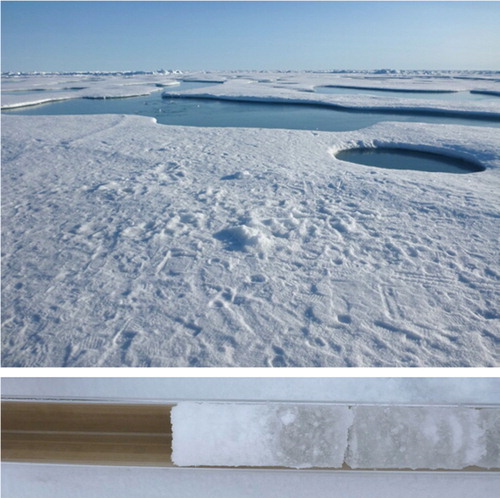
Fig. 3 Temperature (°C), bulk salinity, density (kg m−3), brine and air volume (%) at station 226 representing (a–d) multi-year ice and (e–h) station 237 representing first-year ice.
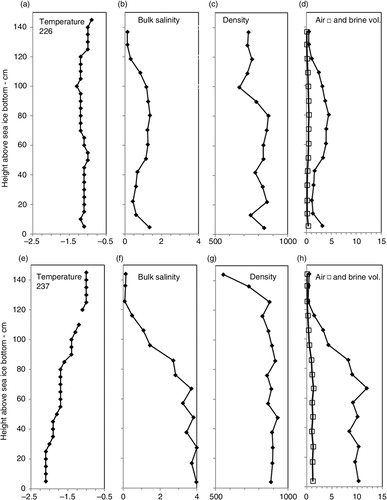
Table 1 Station identification number (Julian day), position, K d(photosynthetically active radiation [PAR])i (m−1) of the ice, K d(PAR)w (m−1) of the water, transmittance (%), PAR (µmol photons m−2 s−1) under-ice, chl-a (mg chl-a m−3) in the water, chl-a (mg chl-a m−2) in the ice, coloured dissolved organic matter (CDOM) absorption coefficient a 375 (m−1) in the water, freeboard of the ice (cm), thickness of deteriorated ice (cm) and ice thickness (cm). M signifies multi-year ice and F signifies first-year ice.
Fig. 4 (a) Ice thickness (cm), (b) photosynthetically active radiation (PAR) transmittance (τ,%), (c) diffuse attenuation coefficient K d(PAR) (m−1) of the ice, (d) chl-a (mg chl-a m−3) in water below ice, (e) coloured dissolved organic matter (CDOM) absorption coefficient—a 375 (m−1) in water, and (f) diffuse attenuation coefficient K d(PAR) (m−1) in the water.
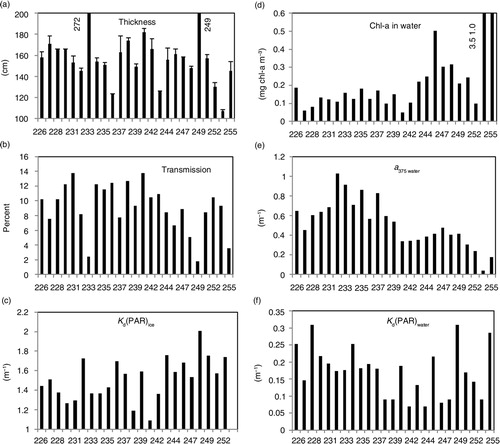
Fig. 5 Ice thickness (cm) versus ln (photosynthetically active radiation [PAR] transmittance).
![Fig. 5 Ice thickness (cm) versus ln (photosynthetically active radiation [PAR] transmittance).](/cms/asset/2e68c2af-991d-42b0-b9fe-b49ecbabe558/zpor_a_11818902_f0005_ob.jpg)
Fig. 6 Under-ice light partitioning for the central Arctic Ocean (>88°N). Coloured dissolved organic matter is abbreviated to CDOM.
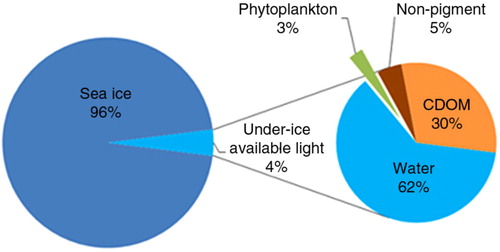
Fig. 7 Spectral attenuation coefficient K d(λ) (m−1) at stations 231 and 246 and in pure water (Pope & Fry Citation1997).
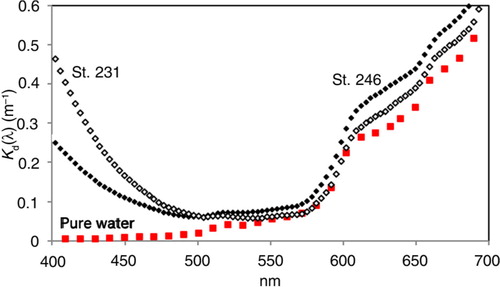
Fig. 8 Spectra of absorption coefficients (m−1) for phytoplankton and ice algae. Spectral distribution of in situ absorption of light (m−1) calculated as the absorption coefficient * fraction of PAR at the wavelength (a(λ) * I f(λ)). The blue line is the normalized (PAR=1) spectrum below the ice.
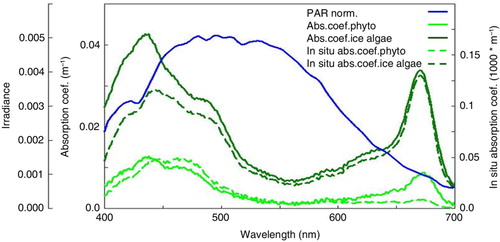
Table 2 The absorption efficiency—A e—(dimensionless) for ice algae and phyto-plankton at surface and under-ice light spectrum, respectively.