
Figures & data
Fig. 1 Sample stations in 1991, 1997 and 2012, with the number of stations shown in parentheses, and median September sea-ice extent in 2013 and the 1981–2011 median sea-ice extent.
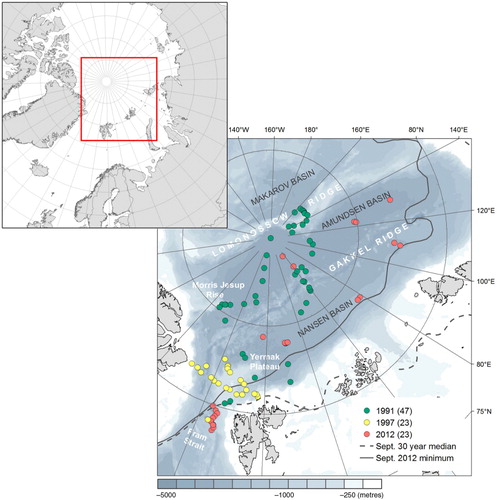
Table 1 Overview of stations sampled with RV Polarstern used for this study. More detailed station information (coordinates, date, water depth) is provided in Supplementary Table S1.
Table 2 Number of sample stations, depth range, number of species and major taxonomical groups and the mean, minimum and maximum parameters abundance (individuals m−2), biomass (mg C m−2) and production (mg C m−2 y−1).
Fig. 2 Macrobenthic abundance (ind. m−2) and estimated production (mg C m−2 y−1). For bathymetry, see .
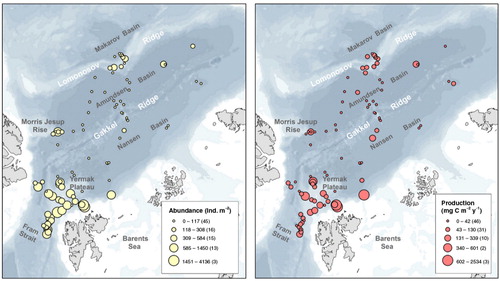
Fig. 3 Comparison of (a) macrobenthic abundance, (b) biomass and (c) production between depth zones (upper slope, lower slope, basin), sea-ice zones (ice-free, marginal ice zone [MIZ], ice-covered) and latitudinal bands (78–80°, 80–82°, 82–84°, 84–86°, 86–88°, 88–90°N) in a box-plot (minimum, maximum and mean). Letters above bars indicate significant differences between groups as identified by ANOVA (depth zone) and ANCOVA with depth as co-variable (sea-ice zone, latitude) and (Student's t) post hoc test on differences between means. Plots are based on transformed (Box–Cox) data to meet ANOVA/ANCOVA preconditions; the y axis shows the corresponding non-transformed raw data (making the scale non-linear).
![Fig. 3 Comparison of (a) macrobenthic abundance, (b) biomass and (c) production between depth zones (upper slope, lower slope, basin), sea-ice zones (ice-free, marginal ice zone [MIZ], ice-covered) and latitudinal bands (78–80°, 80–82°, 82–84°, 84–86°, 86–88°, 88–90°N) in a box-plot (minimum, maximum and mean). Letters above bars indicate significant differences between groups as identified by ANOVA (depth zone) and ANCOVA with depth as co-variable (sea-ice zone, latitude) and (Student's t) post hoc test on differences between means. Plots are based on transformed (Box–Cox) data to meet ANOVA/ANCOVA preconditions; the y axis shows the corresponding non-transformed raw data (making the scale non-linear).](/cms/asset/240c5a70-d5af-4355-8922-b6df6ff73f37/zpor_a_11818933_f0003_ob.jpg)
Fig. 4 Relative abundance of major groups Annelida, Arthropoda, Porifera, Mollusca, Cnidaria and Echinodermata. The group “Others” combines Bryozoa, Cephalorhyncha, Chordata, Entoprocta, Nematoda, Nemertea and Sipuncula.
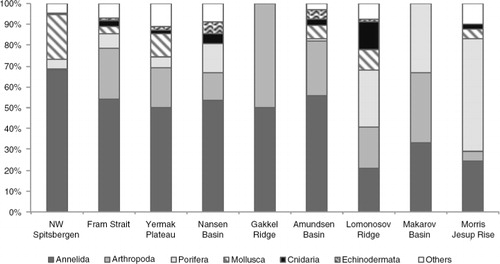
Table 3 Differences in macrofaunal abundance, biomass and estimated production between regions (see , , ), latitudinal bands (78–80°, 80–82°, 82–84°, 84–86°, 86–88°, 88–90°N) and areas differing in sea-ice concentration (ice-free <10%, marginal ice zone, ice-covered >80%) as identified by one-way ANCOVA with water depth as covariate. Differences between depth ranges (upper slope <1500 m, lower slope 1500–3000 m, basin >3000 m) were tested with ANOVAs.
Fig. 5 Relative biomass of major groups Annelida, Arthropoda, Porifera, Mollusca, Cnidaria and Echinodermata. The group “Others” combines Bryozoa, Cephalorhyncha, Chordata, Entoprocta, Nematoda, Nemertea and Sipuncula.
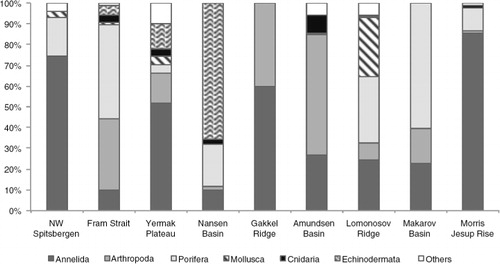
Fig. 6 Relative production of major groups Annelida, Arthropoda, Porifera, Mollusca, Cnidaria and Echinodermata. The group “Others” combines Bryozoa, Cephalorhyncha, Chordata, Entoprocta, Nematoda, Nemertea and Sipuncula.
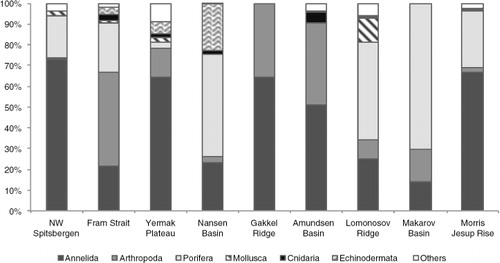
Fig. 7 Macrofauna feeding types (%) based on production data per region.
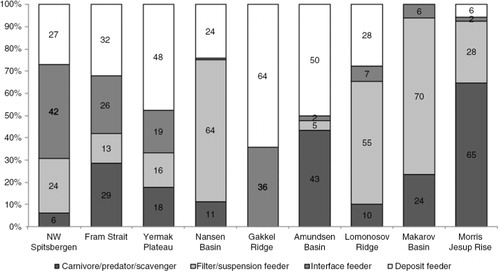
Table 4 Mean community production (P) and productivity (P/B) values found in literature, ordered after increasing water depth. When originally given in other units, data were converted to carbon using conversion factors from the database of Brey (Citation2012, database version 4, www.thomas-brey.de/science/virtualhandbook).