
Figures & data
Fig. 1 The study area: (a) Svalbard Archipelago, (b) Hornsund fjord, west Spitsbergen, (c) surroundings of the Hornsund Station showing the location of the Rotjesfjellet (left) and Ariekammen (right) transects (maps from the Norwegian Polar Institute).
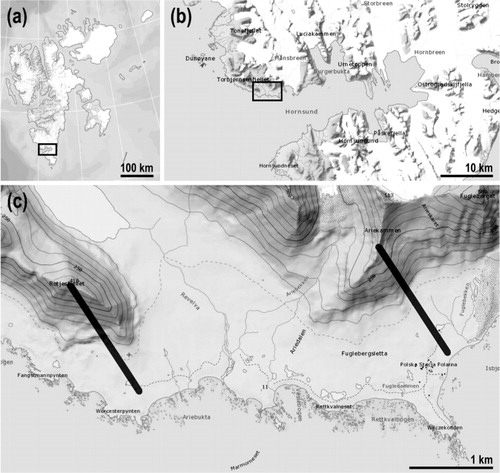
Fig. 2 One of the two males of Milnesium asiaticum Tumanov, 2006 found during the present study.
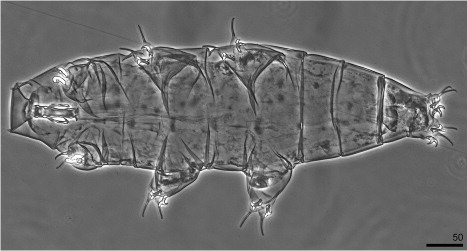
Fig. 3 Ordination diagram of detrended canonical correspondence analysis showing relation of particular tardigrade species (triangles) to altitude and types of substrate (moss or lichen, soil or rock; arrows). Eigenvalue of the first axis: 0.562; second axis: 0.374. Monte Carlo permutation test: F=3.446, p=0.004.
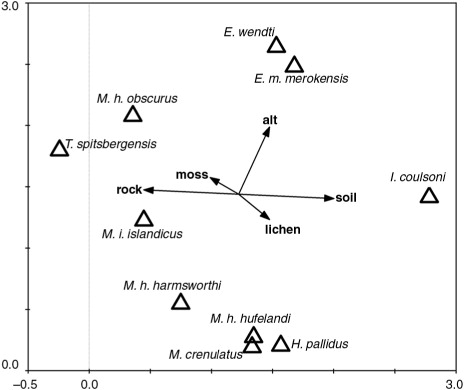
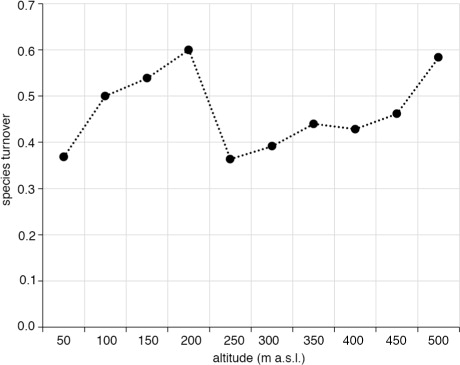
Fig. 4 Relationship between altitude and species turnover (β-diversity).
Supplemental material