
Figures & data
Fig. 1 Bathymetric maps showing the Arctic Ocean. The Catlin Arctic Survey ice base (CIB) is marked with a red dot (78°N, 104°W) on map (a). The Catlin Arctic Survey expedition transect sampling locations are marked with red dots on map (b) between 85°N to 90°N. (c) An enlarged map of Deer Bay overlaid with a satellite image from 8 February 2010, also showing the location of the CIB marked by a red dot.
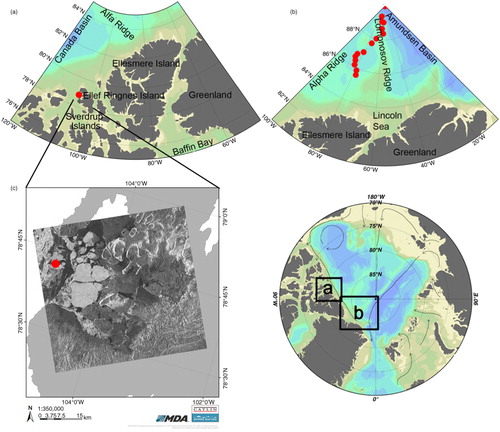
Table 1 Ice core collection data, size of each section (top, middle and bottom), total core length and snow cover.
Fig. 2 Wind speed (m s−1) and air temperature (°C) measured at the Catlin Ice Base (CIB) during March and April 2010.
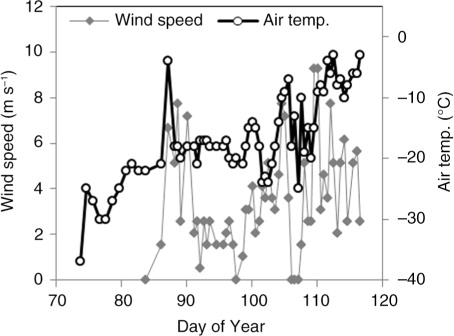
Fig. 3 Under the sea-ice water column profiles through the field campaign from 17 March to 26 April 2010 (different colours represent the different sample dates) for (a) 0 to 50 m temperature, (b) 0 to 50 m salinity, (c) 0 to 220 m temperature and (d) 0 to 220 m salinity. (e) Potential temperature versus salinity plots, overlaid with isopycnals, for all data from the full depth profiles, also highlighting every 50 m depth. (f) Nitrate versus phosphate concentrations (mean±1 SD) for each depth over the field campaign, also showing the PO4 versus NO3 regression lines expected for Atlantic Water (AW) and Pacific Water (PW; from Jones et al. 1998).
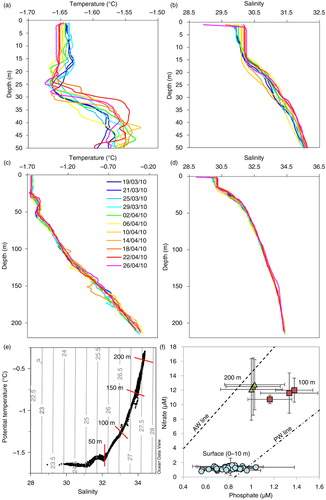
Fig. 4 (a) Uncalibrated acoustical backscatter intensity data from the 300-kHz acoustic doppler current profiler deployed for three days beneath the ice; (b) current speeds from the same instrument, showing significant variability and vertical shear, overlying lines indicate tidal elevation from the Webtide model (solid blue line) and current speeds averaged over the top 45 m and over 15 min (solid red line); and (c) current direction from the same instrument (degrees).
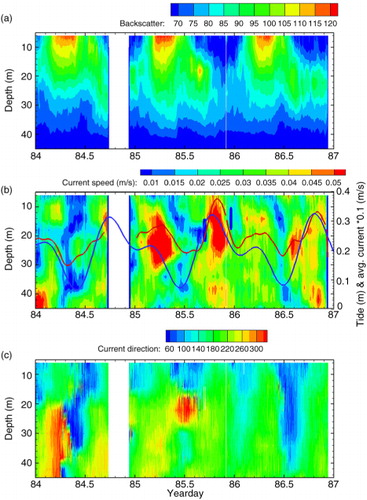
Fig. 5 (a–d) Average (mean) surface conditions (1 to 10 m of seawater) through the sampling period for (a) nitrate (µM), ammonium (µM) and chlorophyll (mg m−3), (b) phosphate (µM) and silicate (µM), (c) total inorganic carbon (CT, µmol kg−1) and total alkalinity (AT, µmol kg−1) and (d) seawater pCO2 (pCO2sw), atmospheric pCO2 (pCO2atm) measured at the ice base by the eddy covariance system and pCO2 from the Alert weather station (pCO2atm Alert, [Dlugokencky et al. Citation2015]). (e–l) Average depth profiles for (e) nitrate, (f) phosphate, (g) silicate, (h) ammonium, (i) total inorganic carbon concentration (CT), (j) total alkalinity (AT), (k) pHT and (l) aragonite saturation state (aragonite Ω). The error bars represent ±1 standard deviation.
![Fig. 5 (a–d) Average (mean) surface conditions (1 to 10 m of seawater) through the sampling period for (a) nitrate (µM), ammonium (µM) and chlorophyll (mg m−3), (b) phosphate (µM) and silicate (µM), (c) total inorganic carbon (CT, µmol kg−1) and total alkalinity (AT, µmol kg−1) and (d) seawater pCO2 (pCO2sw), atmospheric pCO2 (pCO2atm) measured at the ice base by the eddy covariance system and pCO2 from the Alert weather station (pCO2atm Alert, [Dlugokencky et al. Citation2015]). (e–l) Average depth profiles for (e) nitrate, (f) phosphate, (g) silicate, (h) ammonium, (i) total inorganic carbon concentration (CT), (j) total alkalinity (AT), (k) pHT and (l) aragonite saturation state (aragonite Ω). The error bars represent ±1 standard deviation.](/cms/asset/651fe1d6-2faf-479c-8d99-42bde140d426/zpor_a_11818931_f0005_ob.jpg)
Table 2 Biogeochemical measurements averaged across all ice cores for each section (top, middle and bottom). Values are mean±standard deviation.
Table 3 Data from CO2 eddy covariance system. Median values±standard error. Positive values for fluxes of sensible heat/CO2 indicate transport of heat/CO2 away from surface into the atmosphere
Fig. 6 Water column profiles at each latitude (shown as different colours) from the Catlin Explorer Transect for (a) salinity and (b) temperature; (c) potential temperature vs salinity plot for the upper 50 m, overlaid with isopycnals. Each figure also shows the upper 50 m Catlin Ice Base data as a comparison (light blue, 78°N). (d) Nitrate versus phosphate concentrations (mean±1 SD) for surface (0 – 10 m) over the transect, also showing the PO4 vs NO3 regression lines expected for Atlantic Water (AW) and Pacific Water (PW; from Jones et al. Citation1998).
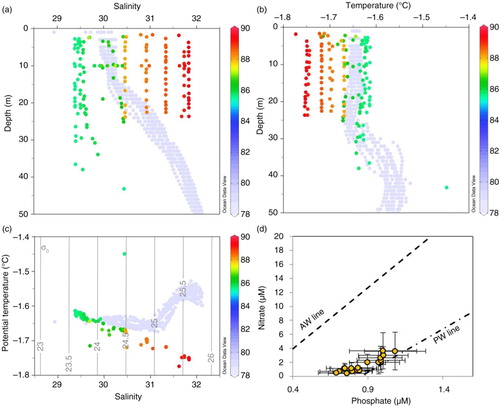
Fig. 7 Average (mean±1 SD) surface (0 to 10 m) seawater conditions under the sea ice along the Catlin Explorer Transect from 85°N to the North Pole for (a) salinity and temperature (°C); (b) chlorophyll (mg m−3), ammonium (µM) and nitrate (µM); (c) total inorganic carbon (CT, µmol kg−1) and total alkalinity (AT, µmol kg−1); (d) phosphate and silicate (µM); (e) pH (total scale) and aragonite saturation state (aragonite Ω) and (f) pCO2 of seawater, also showing the average atmospheric pCO2 measured at Alert Station over the duration of the transect (pCO2atm Alert [Dlugokencky et al. Citation2015]).
![Fig. 7 Average (mean±1 SD) surface (0 to 10 m) seawater conditions under the sea ice along the Catlin Explorer Transect from 85°N to the North Pole for (a) salinity and temperature (°C); (b) chlorophyll (mg m−3), ammonium (µM) and nitrate (µM); (c) total inorganic carbon (CT, µmol kg−1) and total alkalinity (AT, µmol kg−1); (d) phosphate and silicate (µM); (e) pH (total scale) and aragonite saturation state (aragonite Ω) and (f) pCO2 of seawater, also showing the average atmospheric pCO2 measured at Alert Station over the duration of the transect (pCO2atm Alert [Dlugokencky et al. Citation2015]).](/cms/asset/6a4ca595-72c8-416c-a785-c64746fab086/zpor_a_11818931_f0007_ob.jpg)
Table 4 Catlin Explorer Transect sample information: date, location (latitude and longitude), snow thickness and ice thickness.