Figures & data
Fig. 1 Map of the eastern Canadian Arctic. Inset indicates the sampling location in Allen Bay and Resolute Bay, off Cornwallis Island.
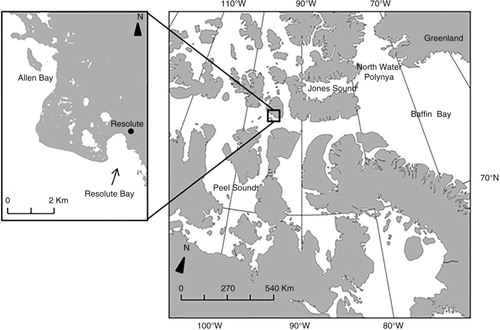
Table 1 Sample collection information of ringed seals, belugas and narwhals in Allen Bay and Resolute bay in 2010 and 2011.
Fig. 2 Frequency distribution of Arctic cod size (fork length [FL], mm) found in the stomachs of ringed seals, belugas and narwhals. The symbol O represents the number of otoliths sampled, and S represents the number of stomachs collected. Arctic cod fork length was extrapolated from otolith length (OL) using FL=24.20*OL – 4.29 (Matley et al. Citation2013).
![Fig. 2 Frequency distribution of Arctic cod size (fork length [FL], mm) found in the stomachs of ringed seals, belugas and narwhals. The symbol O represents the number of otoliths sampled, and S represents the number of stomachs collected. Arctic cod fork length was extrapolated from otolith length (OL) using FL=24.20*OL – 4.29 (Matley et al. Citation2013).](/cms/asset/149793d5-fb25-4601-a265-ce0c775a4cb3/zpor_a_11818912_f0002_ob.jpg)
Fig. 3 Smoothing functions (k=3) of general additive modelling on the size of Arctic cod consumed by ringed seals in relation to age (a) and length (b). The y axes represent the smoothing function centred at zero and the estimated degrees of freedom for each explanatory variable. The adjusted R 2 for this model is 0.47. The dark line represents the overall mean, shaded areas are 95% confidence intervals, and small lines on the x axes are observations at each predictor level.
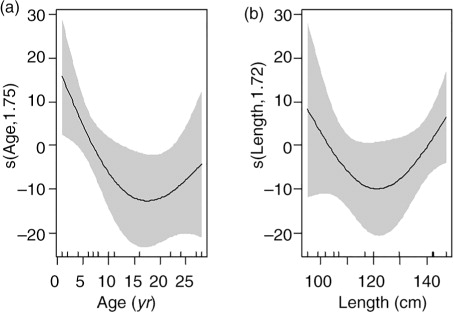
Table 2 Number of prey, frequency of occurrence (FOi) and percent composition (Ni) of ringed seal, beluga and narwhal food items.
Table 3 Model selection from generalized additive modelling (GAM) examining the effect of ringed seal age and length on the size of consumed Arctic cod (FL). Akaike information criterion accounting for small sample size (AICc) was used to select the best models (i.e., lower AICc), and the relative importance of each model—its weight—is indicated.
Table 4 Sample number (n), mean±1 standard error (SE) of liver and muscle δ15N (‰) and δ13C (‰) of ringed seals, belugas and narwhals collected near Resolute in 2010 and 2011.
Table 5 Summary of ANCOVA results testing the effect of ringed seal maturity (adult ≥6 years old, juvenile/pup < 6 years old) and length (covariate) on muscle and liver δ13C and δ15N values. Significant relationships (p≤0.05) are in boldface.
Fig. 4 Isotope biplot of potential prey sources (mean±SD) of ringed seals, belugas and narwhals, corrected for trophic discrimination by subtracting 3.1 and 0.6‰ from ringed seal values for liver δ15N and δ13C, respectively, as well as 2.4 and 1.3‰ for muscle (Hobson et al. Citation1996). The discrimination factors used for the toothed whales were 2.78 and 1.27‰ for liver δ15N and δ13C, respectively, and 1.23 and 1.26‰ for muscle (Caut et al. Citation2011). Prey were collected from Allen Bay in 2010, except for the following species: Gonatus fabricii and Reinhardtius hippoglossoides collected in Davis Strait in 2011 (Watt & Ferguson Citation2015) and Mallotus villosus collected in Cumberland Sound 2008 (Dennard et al. Citation2009).
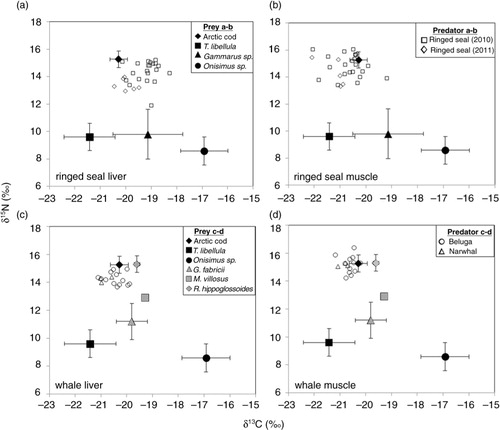
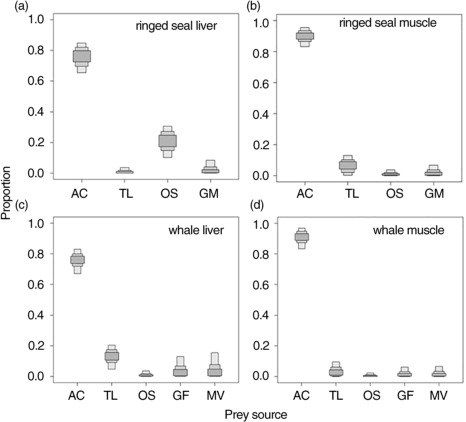
Fig. 5 Contribution of common prey sources based on isotopic mixing model output for ringed seal and toothed whale (belugas and narwhals combined) liver and muscle from 2010. Prey sources used in the models were Arctic cod and/or Reinhardtius hippoglossoides (AC), Themisto libellula (TL), Onisimus sp. (OS), Gammarus sp. (GM), Gonatus fabricii (GF) and Mallotus villosus (MV). The boxplots represent probability densities for credibility intervals of 95% (lighter boxes), 75%, and 50% (darker boxes).