Figures & data
Fig. 1 Studied basibiont ascidian species: (a) Corella antarctica, dorsal view; (b) Cnemidocarpa verrucosa, lateral view; (c) Molgula pedunculata, lateral view. Scale bars: 1 cm.
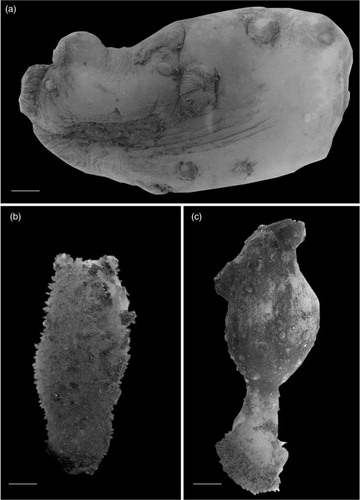
Table 1 List of epibiotic taxa found on the three ascidian species. Asterisks indicate presence of a given taxa.
Fig. 2 Relative abundance (%) of higher epibiotic taxa (phylum/division) on the three basibiont ascidian species.
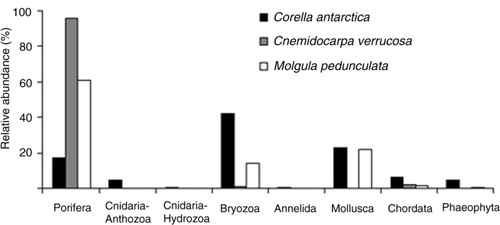
Table 2 Comparative parameters of basibiont ascidian species and their epibiotic community: basibiont body size (range), species richness (S′) (number of epibiotic taxa), percent cover (%), Shannon-Wiener (H’) and Evenness (J’) indices (expressed as mean±standard error). Values of F and P corresponding to ANOVA analyses between basibiont species are also indicated. Letters in parentheses indicate significant differences between species (Bonferroni post-hoc test, p<0.05).
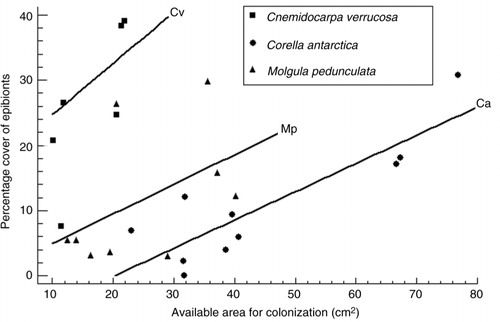
Fig. 3 Linear regression analyses between percent cover of epibionts and available area for colonization on the basibiont ascidian individuals of Corella antarctica (Ca), Cnemidocarpa verrucosa (Cv) and Molgula pedunculata (Mp).