Figures & data
Fig. 1 (a) Regional setting of the study area; (b) map of Severnaya Zemlya Archipelago with location of study sections.
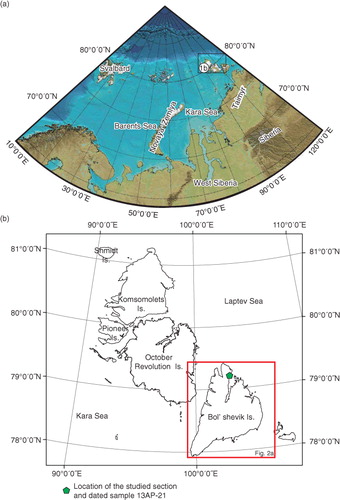
Fig. 2 (a) Simplified geological map of Bol'shevik Island (modified after Makar'ev Citation2013); (b) composite stratigraphic section of Palaeozoic rocks of Bol'shevik Island. (For a larger version of this figure, see Supplementary File 3.)
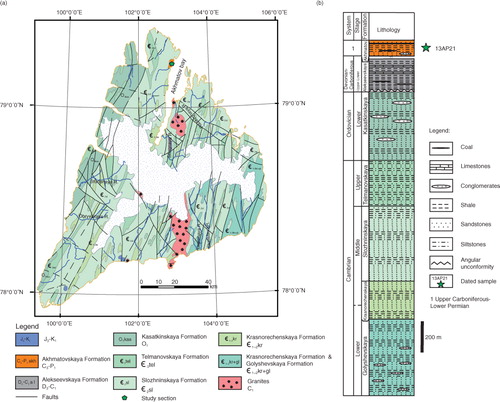
Fig. 3 Photographs of the studied Upper Carboniferous–Permian deposits: (a) general view of outcrop intercalation of siltstones, sandstones and coals (flood plain environments); (b) close-up view of outcrop; (c) trough-cross bedded sandstone (filling in channel).
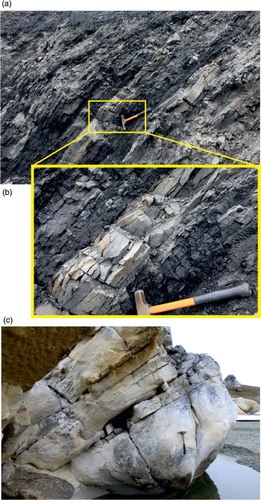
Fig. 4 (a) Geological map of north-western part of Akhmatov Bay, Oleniy Peninsula, Bol'shevik Island; (b) geological cross-section across the Akhmatovskaya Formation; (c) stereographic projections of bedding poles of the Akhmatovskaya Formation.
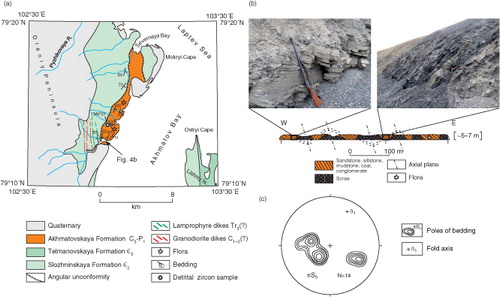
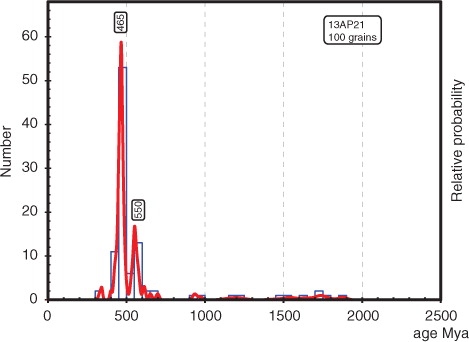
Fig. 5 Probability distribution plot of zircon U/Pb ages of the studied sample.