Figures & data
Table 1 Characteristics of decontaminated North Greenland Eemian Ice Drilling core samples subjected to microbiological analyses.
Fig. 1 Distribution of colony-forming units (CFU) representing different phyla/classes cultivated from each North Greenland Eemian Ice Drilling core sample.
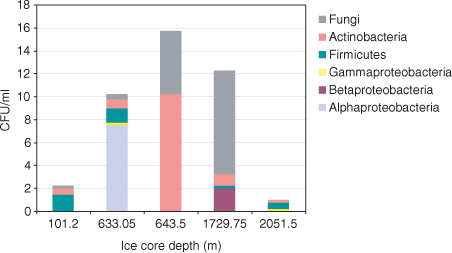
Fig. 2 Phylogenetic relationships of small subunit rRNA genes of isolates from decontaminated North Greenland Eemian Ice Drilling core samples from different depths. The tree is based on distance analysis (neighbour-joining algorithm with the Juke-Cantor model). Bootstrap values greater than 50% generated from 100 replicates are shown above the nodes. Accession numbers for these isolates and for closely related environmental cultured representatives retrieved from databases are included. Area in grey highlights the subcluster of the novel alphaproteobacterium and its closest relatives.
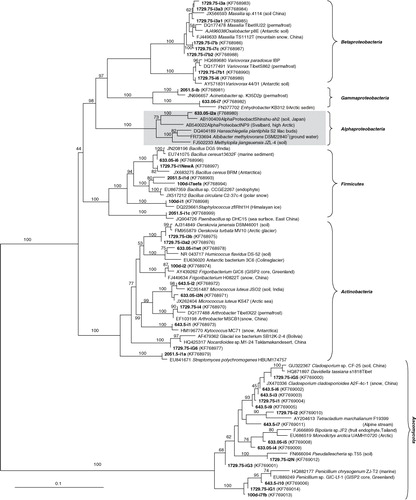
Table 2 Number of isolate small subunit rRNA gene sequences observed operational taxonomic units (Sobs), richness and diversity indices for North Greenland Eemian Ice Drilling core samples from different depths.
Fig. 3 Neighbour-joining tree of SSU rRNA gene clone sequences from different depths of North Greenland Eemian Ice Drilling glacial ice. For groups with highly similar clone sequences from the same ice core sample, a single representative was chosen. Bootstrap values greater than 50% generated from 1000 replicates are shown above the nodes.
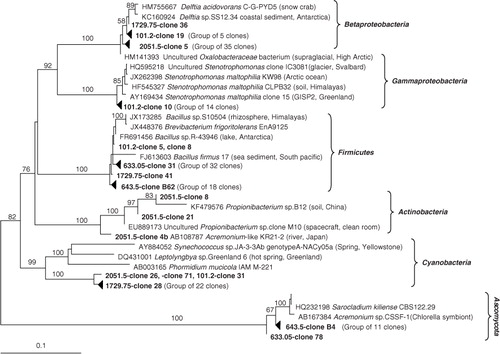
Table 3 Number of small subunit rRNA gene clone sequences, observed operational taxonomic units (Sobs), richness and diversity indices at genus level for North Greenland Eemian Ice Drilling core samples from different depths.
Table 4 Number of Illumina small subunit rRNA gene sequences, observed operational taxonomic units (Sobs), richness and diversity indices for North Greenland Eemian Ice Drilling core samples from different depths. The average values (±SD) were calculated for genus level. A normalized equal number of sequences (341 215) from each sample were randomly selected for analysis.
Fig. 4 Rarefaction curves of phylotype based operational taxonomic units (OTUs) of the small subunit rRNA gene Illumina sequence reads for North Greenland Eemian Ice Drilling core samples from different depths. Phylotype levels include genus (triangles), family (dots) and order (rectangles).
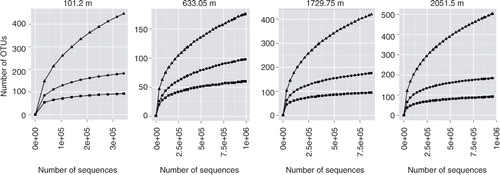
Fig. 5 Distribution of major phyla/classes of small subunit rRNA gene sequences generated by Illumina MiSeq sequencing. The number of reads for each column is given in parentheses. Groups are shown in numerically descending order of sequence reads.
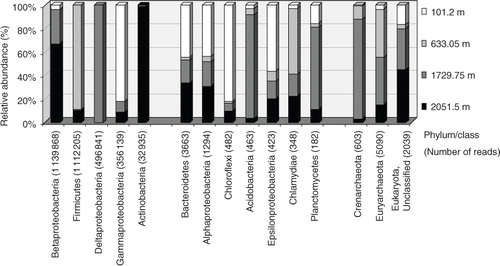
Fig. 6 Relative abundance of genera in North Greenland Eemian Ice Drilling core samples from different depths based on Illumina MiSeq sequencing. Left panels show the most abundant genera (>1%). Right panels show less frequently detected genera (0.02–1%).
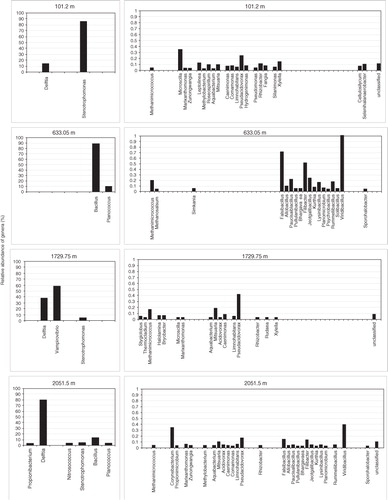
Fig. 7 Principle coordinate analysis of operational taxonomic unit abundance in all samples. Plots of beta diversity were calculated based on weighted Unifrac metrics. The percent variations explained by each coordinate are shown on each axis.
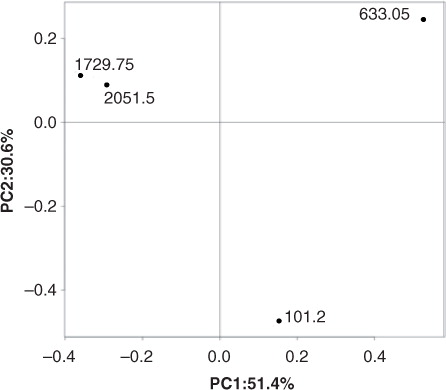
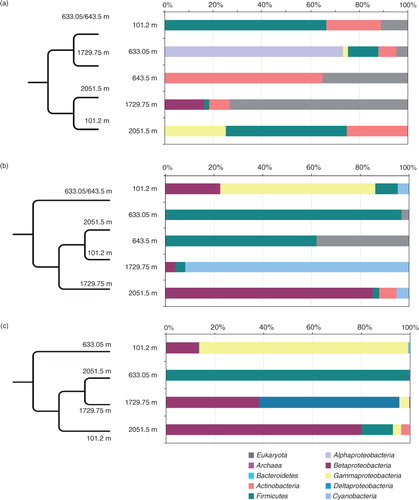
Fig. 8 Distribution of dominant phylogenetic groups in populations from different North Greenland Eemian Ice Drilling ice depths revealed by: (a) cultivation/direct plating; (b) Sanger clone libraries; (c) Illumina next-generation sequencing. Column graphs show percentage of small subunit rRNA gene sequences assigned to different phyla/classes. Dendrograms represent the population structure similarity between the samples at class level based on the thetayc coefficient.