Figures & data
Fig. 1 Graphs depict multi-frequency seawater sampling measurements. (a)–(d) Weekly seawater samples were collected from Arthur Harbor adjacent to Palmer Station, Antarctica over the course of one year (May 2012–May 2013). (e)–(h) Daily measurements were performed for the last three months of the observation period (March–May 2013). Boxed sections in (a)–(d) represent the same time period represented by the corresponding graphs on the right, (e)–(h). Maximum sea-ice coverage depicted in annual seawater chemistry figure panels was 76%. Error bars represent measurement and propagated uncertainties associated with each parameter.
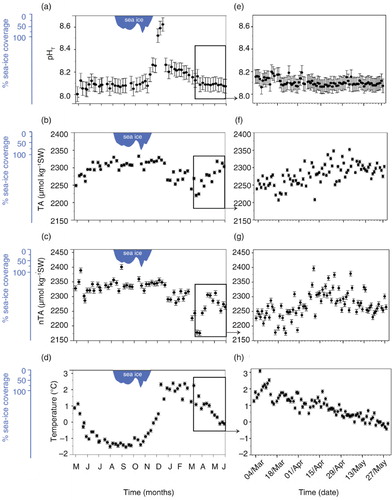
Fig. 2 Graphs depict multi-frequency seawater sampling measurements. (a)–(d) Weekly seawater samples were collected from Arthur Harbor adjacent to Palmer Station, Antarctica over the course of one year (May 2012–May 2013). (e)–(h) Daily measurements were performed for the last three months of the observation period (March–May 2013. Boxed sections in (a)–(d) represent the same time period represented by the corresponding graphs on the right, (e)–(h). Maximum sea-ice coverage depicted in annual seawater chemistry figure panels was 76%. Error bars represent measurement and propagated uncertainties associated with each parameter.
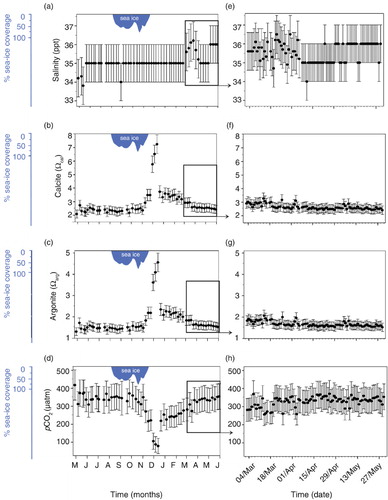
Fig. 3 Graphs depict semidiurnal seawater sampling measurements. Twice daily samples were collected from Arthur Harbor adjacent to Palmer Station, Antarctica to quantify local seawater pHT, total alkalinity (TA), temperature and salinity semidiurnal fluctuations (March–April 2013). Also included are the salinity normalized total alkalinity (nTA), calcium (Ωcal) and aragonite (Ωarg) saturation states and pCO2. Open circles represent semidiurnal seawater variations calculated for the day (Δday) and filled circles represent seawater variations calculated for the night (Δnight). Horizontal lines at zero indicate no net change. Error bars represent measurement and propagated uncertainties associated with each parameter.
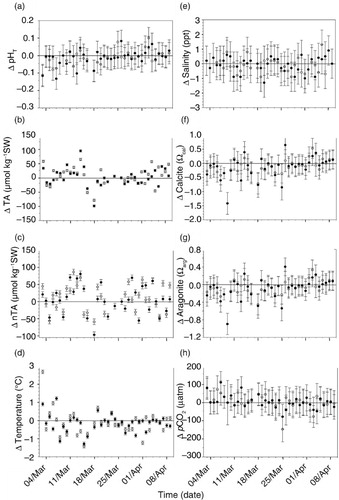
Fig. 4 Comparison of dynamics of chl a concentrations and pH measured from the immediate vicinity of Palmer Station by month for one year (May 2012–May 2013, compiled from the Palmer LTER Data Repository). Maximum sea-ice coverage was 76%. Error bars represent measurement uncertainties.
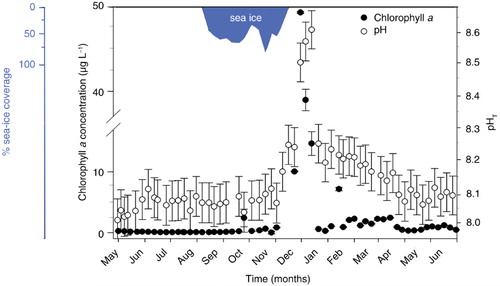
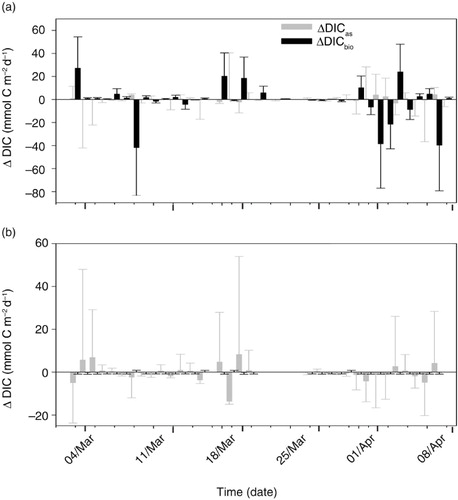
Fig. 5 Drivers of daily dissolved inorganic carbon (DIC) variation calculated for annual and daily DIC (ΔDICas and ΔDICbio). Negative values represent a decrease in DIC between repeat measurements while positive values denote an increase. (a) Drivers of DIC annual variations in DIC computed over the course of one year (May 2012–May 2013, mean ΔDICobs±mean uncertainty, −0.003±0.89 mmol m−2 d−1). Maximum sea-ice coverage over the course of this year was 76%. (b) Drivers of DIC daily variations in DIC computed for daily measurements were performed for the last three months of the observation period (March–May 2013, mean ΔDICobs±mean uncertainty, 0.85±0.96 mmol m−2 d−1). Error bars represent measurement and propagated uncertainties associated with each parameter.
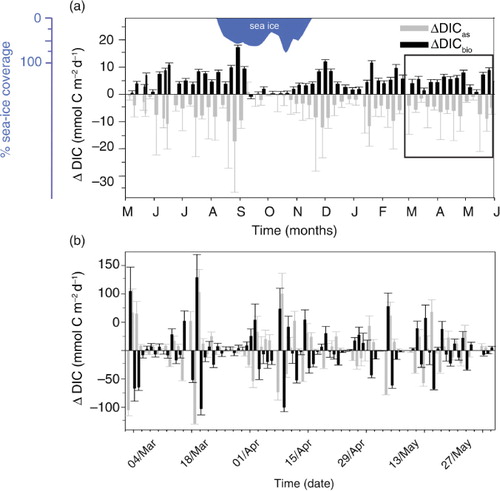
Fig. 6 Controls on semidiurnal variations in dissolved inorganic carbon (DIC; ΔDICas and ΔDICbio). Negative values represent a decrease in DIC between repeat measurements while positive values denote an increase. (a) Semidiurnal variations in DIC computed to have occurred during the day (mean ΔDICobs±mean uncertainty, −0.01±0.88 mmol m−2 d−1). (b) Semidiurnal variations in DIC computed to have occurred during the night (mean ΔDICobs±mean uncertainty, 0.01±0.88 mmol m−2 d−1). Error bars represent measurement and propagated uncertainties associated with each parameter.