
Figures & data
Fig. 1 Study area locations within the Svalbard Archipelago.
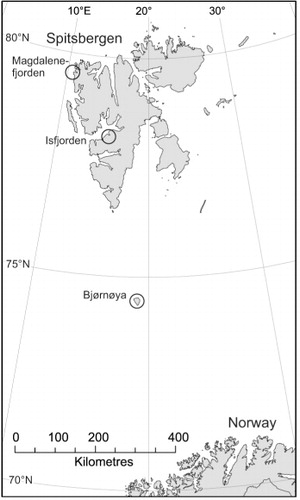
Table 1 Study areas and sampling pattern.
Table 2 Number of species recorded in each site and area of the current study, and summed up for the seabird and control sites.
Fig. 2 Detrended correspondence analysis (DCA) ordination of plots classified with respect to (a) springtail species composition and (b) vegetation composition of the different study areas.
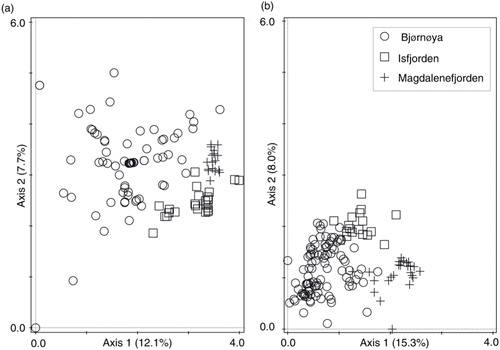
Fig. 3 Canonical correspondence analysis (CCA) ordination of springtail species (triangles) with respect to the influence of different areas—Bjørnøya (Bjo), Isfjorden (Isf) and Magdalenefjorden (Mag)—and the presence (seabird) and absence (control) of a seabird colony in the vicinity of a sampling site (diamonds).
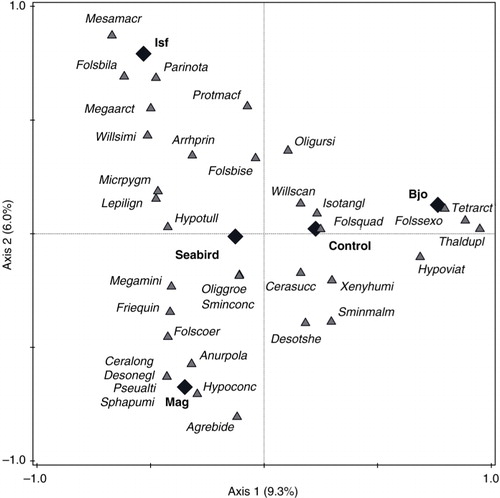
Table 3 Percent of variability in vegetation and collembolan communities explained by hypothetical gradients (axes 1 and 2; detrended correspondence analysis [DCA]) and environmental factors (area and seabird; canonical correspondence analysis [CCA]), with the explaining efficiency of the factors (factors’ contribution to the variation explained by the axes).
Fig. 4 Canonical correspondence analysis (CCA) ordinations of 10 best-fitted species with respect to the seabird factor (axis 1) in each area. Pie slices based on species percentage occurrence within seabird (black) and control (white) sites. Boldface indicates species that significantly and positively react to the seabird explanatory variable (on the basis of t-value biplot).
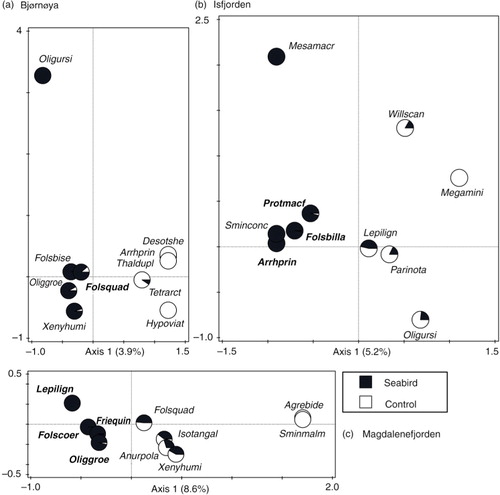
Table 4 Significant positive (+) and negative (−) response of Collembola species for the seabird factor, chosen on the basis of t-value biplots made separately for each area: Bjørnøya (Bjo), Isfjorden (Isf), Magdalenefjorden (Mag) and all the areas together (ALL).