
Figures & data
Fig. 1 Spectra of the three lichen genera used in this study.
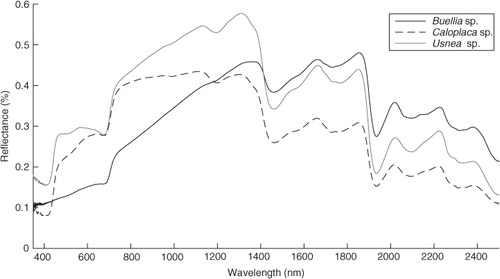
Fig. 2 (a) Location of the ground-truthing sites (open circles) along the Antarctic Peninsula, where the large black squares indicate the extent of the Landsat 7 tiles and the large grey squares indicate the extent of the Landsat 8 tiles. (b) The South Shetland Islands () and (c) the Danco Coast area (close to Anvers Island). The projection of the maps is Lambert Azimuthal Equal Area.
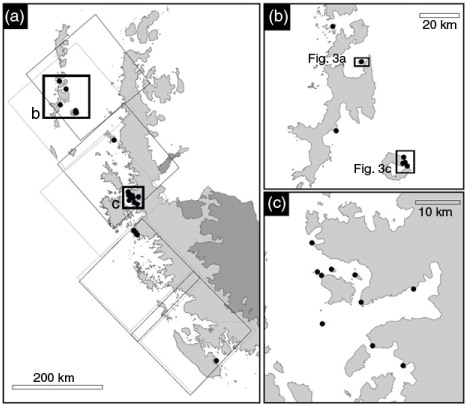
Fig. 3 (a) Normalized Difference Vegetation Index (NDVI; >0.2) analysis for north-west Deception Island and (c) Half Moon Island, South Shetland Islands (see ), using Landsat 8 imagery. (b) Matched filtering analysis for north-west Deception Island and (d) Half Moon Island, using Landsat 7 imagery. (See Supplementary Table S1 for details on the Landsat scenes.) The projection of the maps is Lambert Azimuthal Equal Area.
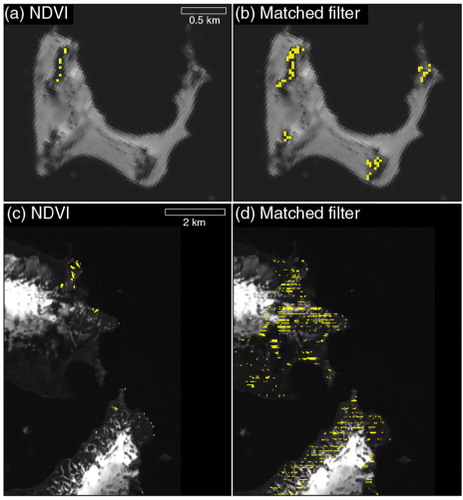
Table 1 Areas covered by the pixels detected as lichen-covered by the matched filtering analysis and Normalized Difference Vegetation Index (NDVI), and the percentages of overlap between them