Figures & data
Fig. 1 Cruise track and locations of ice stations in the Weddell Sea. The sea-ice edge is marked by a dashed line. Operations of different remotely piloted aircraft systems (RPAS)—small unmanned meteorological observer (SUMO), advanced mission and operation research (AMOR) quadcopter, meteorological mini-aerial vehicle (MMAV)—and the portable automatic weather stations (AWS) by station are listed in Supplementary Table S1.
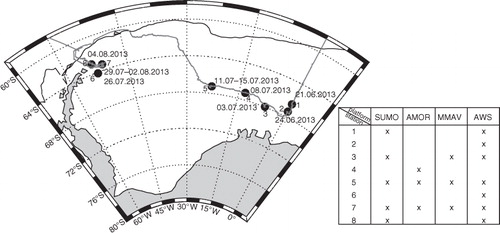
Fig. 2 Examples of the main strategies for vertical profiling with (a) the small unmanned meteorological observer (SUMO) and meteorological mini-aerial vehicle (MMAV) and (b) the advanced mission and operation research (AMOR) quadcopter. For SUMO, two main profiling strategies were used.
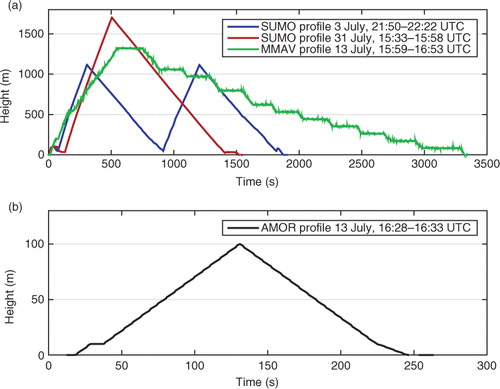
Fig. 3 (a) Average vertical potential temperature profiles from the small unmanned meteorological observer (SUMO) with a maximum altitude of more than 1 km (69 individual profiles) and RV Polarstern radiosonde soundings (RADIO) over the days when SUMO was operated (10 individual profiles). Horizontal lines show standard deviations. (b) Two single case comparisons from 13 to 31 July; note the different vertical scales. SUMO, meteorological mini-aerial vehicle (MMAV) and radiosonde launch times are indicated.
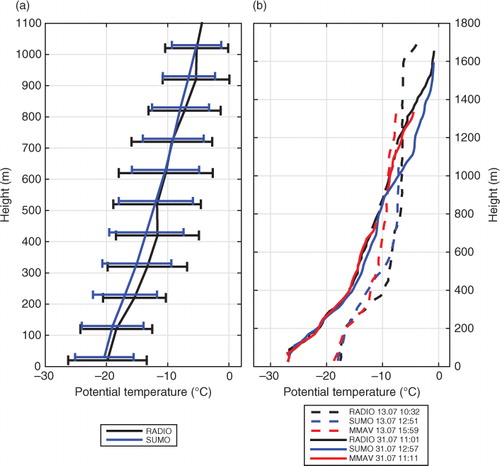
Fig. 4 Small unmanned meteorological observer (SUMO) and advanced mission and operation research (AMOR) quadcopter averaged potential temperature profiles from alternate flights during ice stations 5 and 7. Dates are indicated in the top left corner of each panel.
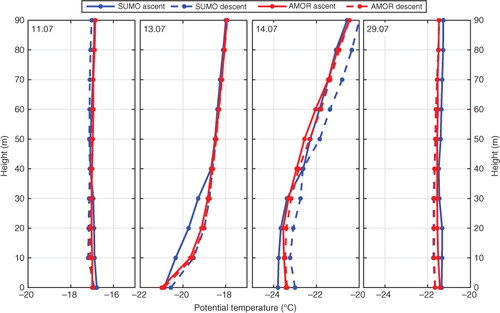
Fig. 5 Mean (red dots) and standard deviation (black bars) of difference between small unmanned meteorological observer (SUMO) and advanced mission and operation research (AMOR) quadcopter potential temperature profiles that are matched in time. The statistics are based on profiles from 11, 13, 14 to 29 July 2013.
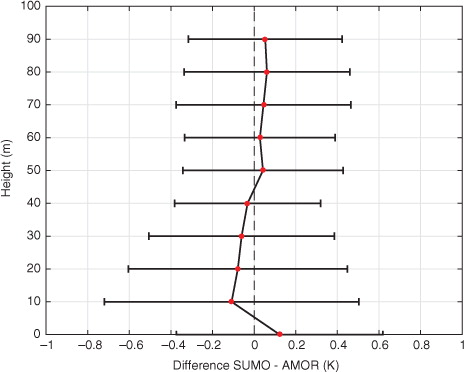
Fig. 6 Temporal evolution of wind speed, wind direction and temperature from the ship (29 m and 39 m) and surface-based meteorological stations (0.5 m and 2 m) at 67.18°S, 23.20°W on 11 July 2013.
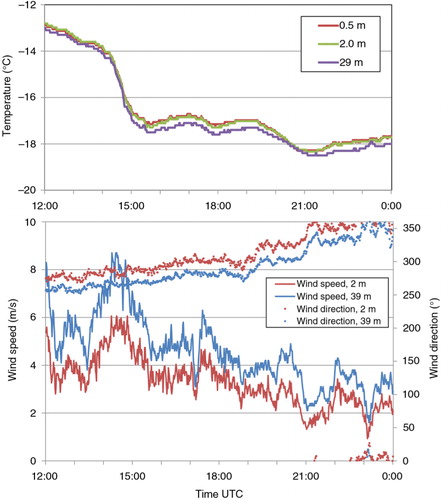
Fig. 7 Vertical temperature profiles from small unmanned meteorological observer (SUMO) and advanced mission and operation research (AMOR) quadcopter on 11 July 2013 at 67.18°S, 23.20°W (in temporal sequence: SUMO descent, AMOR ascent and descent, SUMO ascent). The “raw” (dashed) profiles are provided as is and the other (solid) profiles have been averaged over 10-m height intervals. In the case of AMOR, the average number of samples in each 10-m height interval is 166. For SUMO, the corresponding number is considerably lower at around two samples above 100 m and 12 samples below. Minimum and maximum near-surface (2 m) and ship-based (29 m) temperature measurements during the time of the remotely piloted aircraft systems (RPAS) operations are indicated as well.
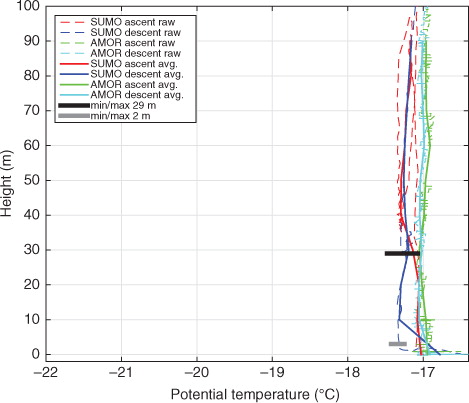
Fig. 8 Temporal evolution of wind speed, wind direction and temperature from the ship (29 m and 39 m) and surface-based meteorological stations (0.5 m and 2 m) at 67.18°S, 23.26°W on 13 July 2013.
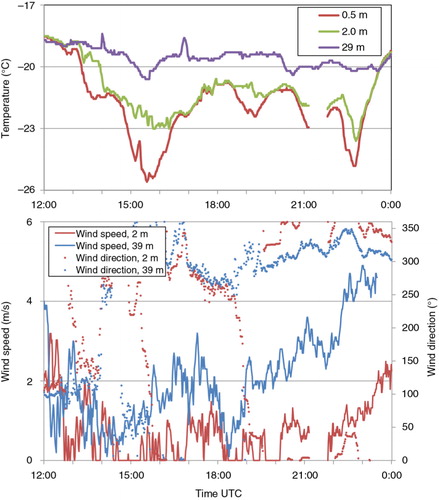
Fig. 9 Vertical temperature profiles from small unmanned meteorological observer (SUMO) and advanced mission and operation research (AMOR) quadcopter on 13 July 2013 at 67.18°S, 23.26°W. The “raw” (dashed) profiles are provided as is and the other (solid) profiles have been averaged over 10-m height intervals. Minimum and maximum near-surface (2 m) and ship-based (29 m) temperature measurements during the time of the remotely piloted aircraft systems (RPAS) operations are indicated as well.
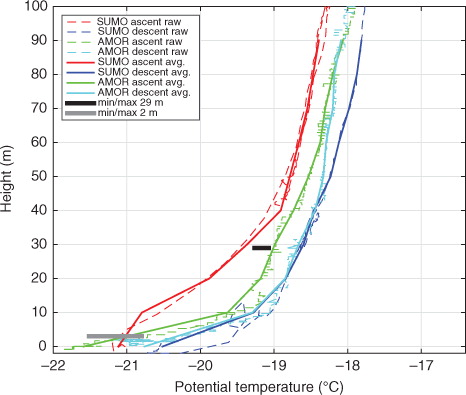
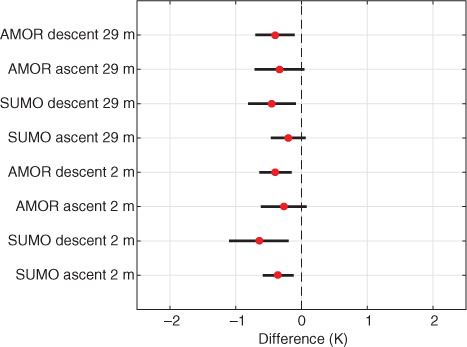
Fig. 10 Bias (red dots) and standard deviation (black bars) of the remotely piloted aircraft systems (RPAS)—small unmanned meteorological observer (SUMO) and advanced mission and operation research (AMOR) quadcopter—temperature profiles with the near-surface (2 m) and ship-based (29 m) temperature measurements. The statistics are based on profiles measured on 11, 13, 14 and 29 July 2013.
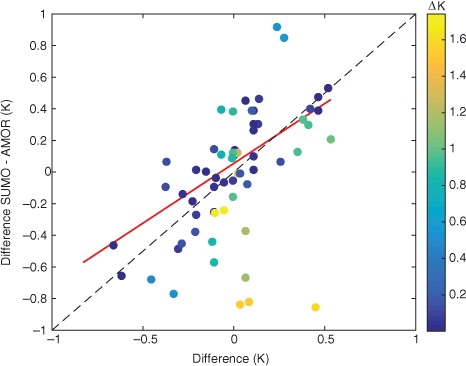
Fig. 11 Difference between the 29 m air temperature observed by small unmanned meteorological observer (SUMO) and advanced mission and operation research (AMOR) quadcopter with a time lag (63 matched profiles with a time difference less than 20 min) versus temporal change in 29 m air temperature over the corresponding time observed at the RV Polarstern automatic weather station. The colours of the dots represent the difference between the 2 m and 29 m automatic weather station temperature. The solid, red line indicates the linear regression between the two and the black dashed line indicates the 1:1 relationship.