
Figures & data
Fig. 1 Study area: water bodies (1), glacier (2), terminal and lateral moraine (3), ground moraine and inner outwash plain on bedrock or dead ice (4), outer outwash plain (5), raised marine terraces (6), main areas of patterned ground occurrence (7), rock outcrops, including relict sea cliffs (8), beach (9), delta sediments in the Nottinghambukta bay (10), pronival fan (11), debris cones (12), solifluction lobes (13), block covers (14), rock glacier faces (15), chutes (16), rock ridge (17), active sea cliffs (18), cabins (19), Stanisław Baranowski Polar Station (B), Hyttevika House (H).
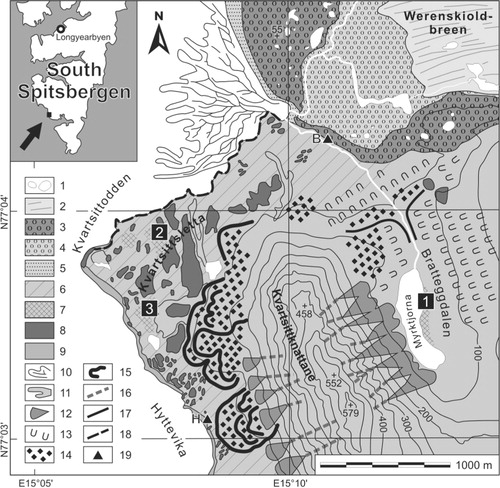
Fig. 2 (a) Profile 1 across sorted circles in the Brattegdallen valley. (b) Profile 2 on non-sorted polygons on a 10 m high raised marine terrace. (c) Profile 3 on the net with sorted coarser material on a 10 m high raised marine terrace. (d) Well-developed sorted circles in the Hornsund fjord, measured by Czeppe (1961) with the Bac movement detector half a century ago. Probably photographed for the first time in 1957, they were presented by Jahn (1975) and Washburn (1979). (Photos by M. Kasprzak.)
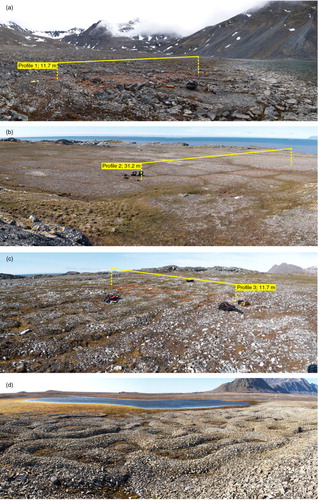
Fig. 3 Inversion results of electrical imaging across (a) sorted circles, (b) non-sorted polygons and (c) sorted net with coarser material. The locations of features are indicated as follows: permafrost table (A), crests of debris rings (B), fine material inside the circles (C), cracks (D) and gravel mounds (E).
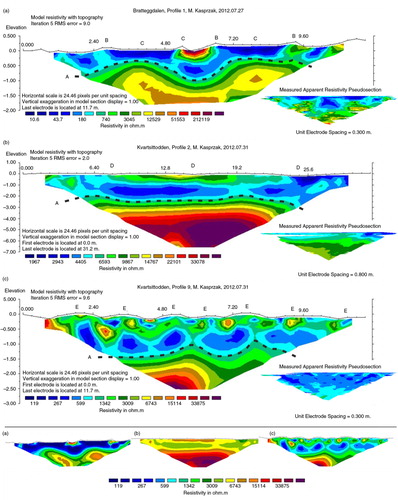
Fig. 4 The comparison of conventional least-squares inversion method from imaging using the dipole–dipole electrode array: (a) after five iterations, (b) after three iterations and (c) from robust inversion method. For comparison, imaging from the Wenner–Schlumberger electrode array is shown in (d).
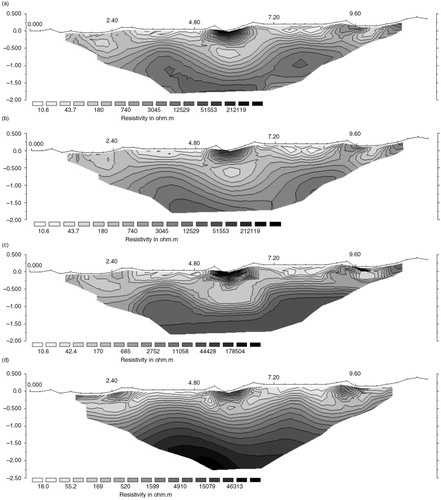
Table 1 Range of resistivity for different materials. Compilation based on Stenzel and Szymanko (Citation1973), Telford et al. (Citation1990), Reynolds (Citation1997), Kearey et al. (Citation2002) and Kneisel & Hauck (Citation2008).