Figures & data
Fig. 1 Bathymetric map (Arndt et al. Citation2013) with seabed temperature measurements at our study location in the South Shetland Margin (red square in the inset) downloaded from the National Oceanographic Data Center (www.nodc.noaa.gov/cgi-bin/OC5/WOA09/woa09.pl). The seabed temperatures are from: autonomous pinniped bathythermograph (APB) data; high and bottle-low resolution conductivity–temperature–depth (CTD) and expendable CTD (XCTD) data; mechanical/digital bathythermograph (MBT and DBT, respectively) and expendable bathythermograph (XBT) data; ocean station data (OSD); profiling float (PFL) data. The map is projected with the coordinate system Polar Stereographic 65°S (Datum: WGS84).
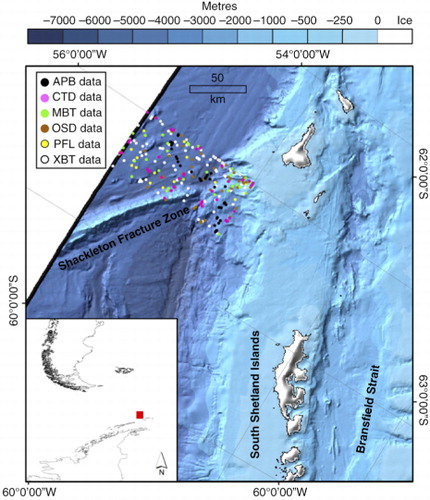
Table 1 Model parameters of the hydrate system in the South Shetland Margin
Fig. 2 (a) Seabed temperature data and interpolated temperature series at our study location in the South Shetland Margin for the period 1958–2010 and for 375, 400, 425 and 450 m water depth (mwd). (b) Interpolated temperature series at each water depth and associated temperature trends for the periods 1960–2010 of 0.0034°C y−1, and 1980–2010 of 0.023°C y−1. Note that the temperature trends were estimated using average temperatures from the four water depths modelled.
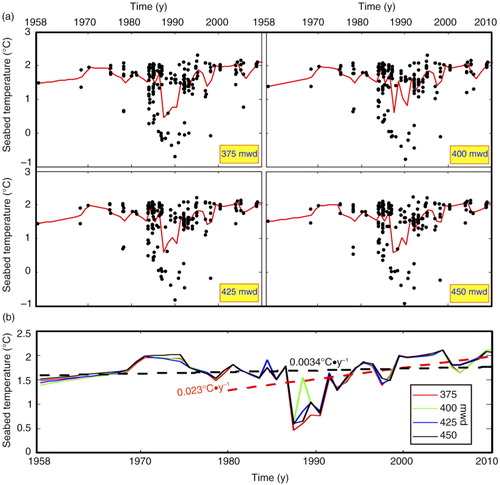
Fig. 3 (a) Comparison between the results obtained at 375 m water depth (mwd) with the steady-state and transient modelling (random distribution, ) approaches for years 1958 (initial conditions) and 2100. The area on the left side of Moridis’ (Citation2003) methane phase boundary for a 3.5% weight total (wt%) salinity contains the pressure and temperature (P–T) conditions for methane hydrate stability. The initial hydrate thickness in both approaches is similar because the transient model is initialized with steady-state conditions. (b) Methane hydrate phase stability boundaries for pure water and 3.5 wt% salinity.
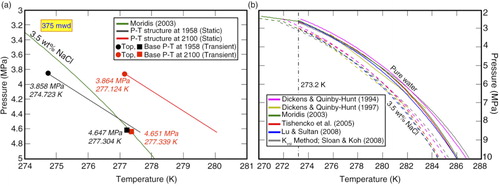
Fig. 4 Results from the random distribution model () for a rate of future seabed warming of 0.023°C y−1. Variations in temperature, pressure change (considered as the positive or negative increment in pore water pressure with respect to the initial hydrostatic), hydrate and gas saturations with time and water depth (mwd).
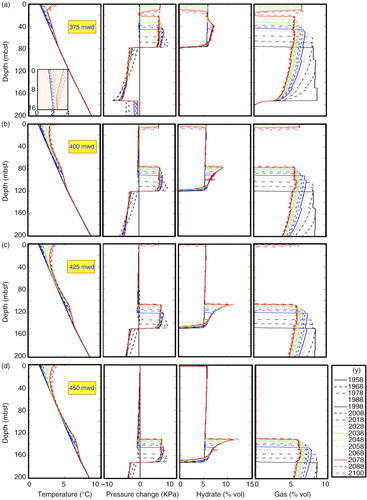
Fig. 5 Past (solid lines) and future (thick black dashed lines) seabed temperatures for the period 1958–2100. Associated seabed methane emissions calculated using the uniform (dashed lines) and random (dashed-point lines) distribution models () for the 0.023°C y−1 future temperature trend. Note that seabed methane emissions do not occur at 450 m water depth (mwd) when using the 0.023°C y−1 temperature trend, and at any water depth for the 0.0034°C y−1 trend.
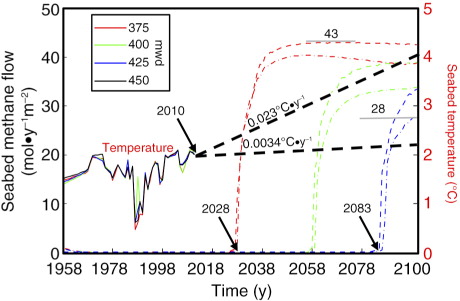
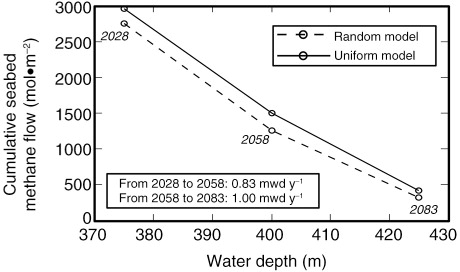
Fig. 6 Cumulative seabed methane emissions by 2100 calculated at 375, 400 and 425 m water depth (mwd) for the random (dashed line) and uniform (solid line) distribution models (). The number below each circle indicates the time of the first seabed methane emission and the inset the propagation rate of methane emissions with water depth. The area under the curves gives the total methane released at the seabed per metre along the margin for the period 2028–2100.