Figures & data
Fig. 1 Study area and sampling sites. (Modified from the Antarctic Digital Database [www.add.scar.org/home/add7] for the coastline and the Antarctic Geospatial Information Center, National Science Foundation, for the ground digital model.)
![Fig. 1 Study area and sampling sites. (Modified from the Antarctic Digital Database [www.add.scar.org/home/add7] for the coastline and the Antarctic Geospatial Information Center, National Science Foundation, for the ground digital model.)](/cms/asset/d39120e6-292e-4da8-a1f6-de5b5aba851e/zpor_a_11821493_f0001_ob.jpg)
Fig. 2 Biomass (sum of chl a, Bchl a and their degradation products, in µg g−1 TOC) versus latitude south.
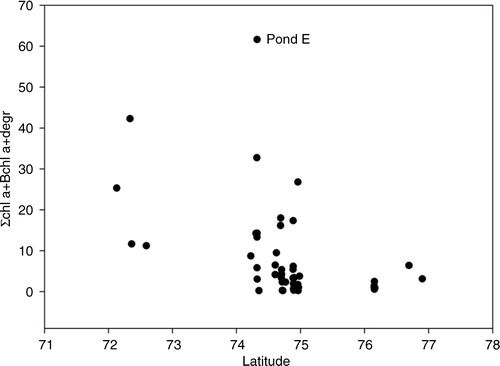
Fig. 3 Total number of pigments versus latitude south. The circle highlights lakes with high nutrient concentrations.
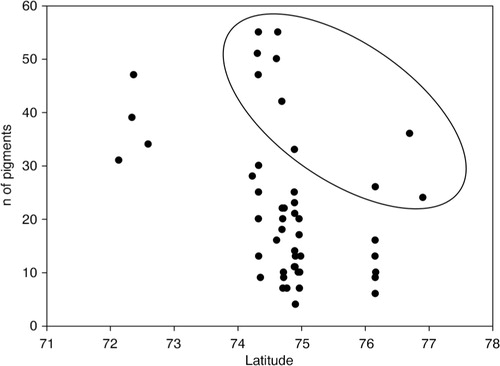
Fig. 4 Total number of identified marker pigments (chl a, chl b, scytonemins, fucoxanthin, violaxanthin, canthaxanthin, zeaxanthin echinenone, lutein, β,ɛ- and β,β-carotene, myxoxanthophyll, neoxanthin, Bchl a) versus latitude south.
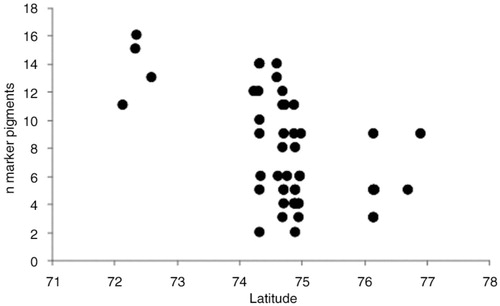
Fig. 5 Species richness (as number of pigments) as function of biomass/productivity (sum of chl a, Bchl a and their degradation products, in µg g−1 TOC).
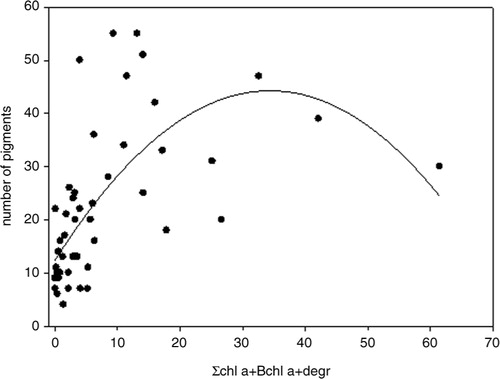
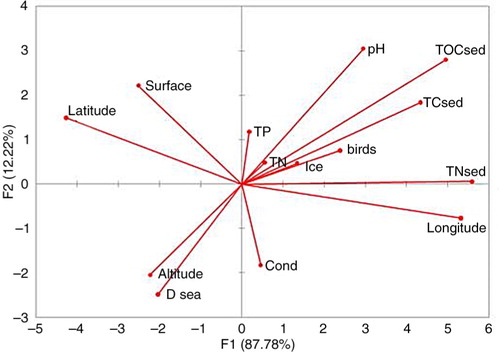
Fig. 6 PCA of (a) physical and (b) chemical characteristics of lakes. Individual ion concentrations were omitted from analysis as all are significantly correlated with conductivity. TNs is sedimentary TN. Supplementary Table S3 provides the identification codes of the lakes.
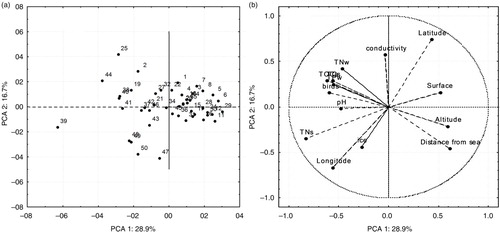
Fig. 7 Biplot resulting from the redundancy analysis.